
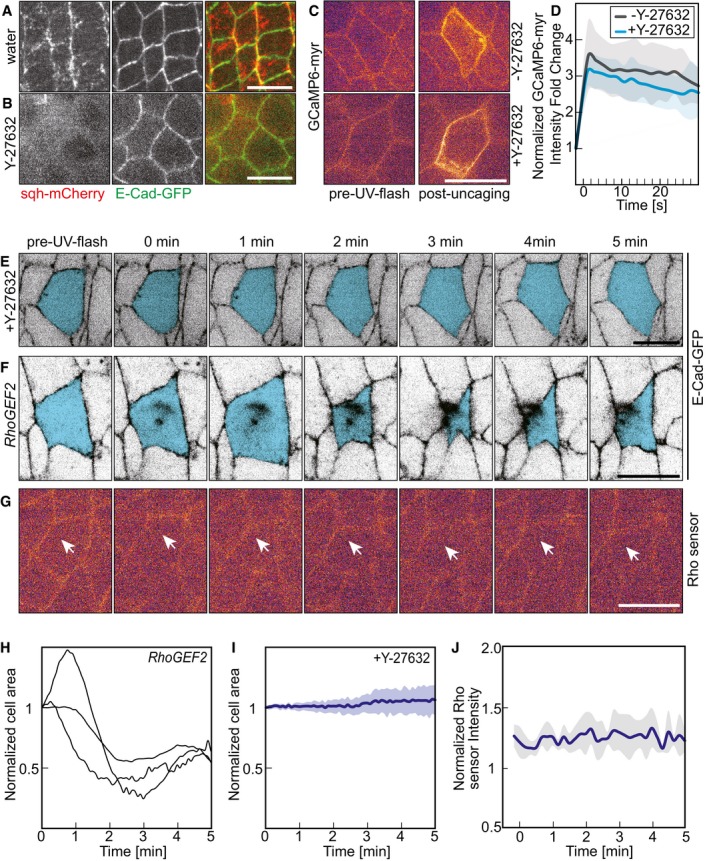
Figure 6. CaLM requires ROCK but not RhoGEF2.
-
A, BConfocal images of embryos expressing sqh‐mCherry and E‐Cadherin‐GFP injected with Y‐27632 (ROCK inhibitor, 10 mM) or water.
-
C, DCaLM in embryos (stage 7, lateral epidermis) expressing a membrane‐bound Ca2+ sensor (GCaMP6‐myr) and injected with NP‐EGTA, AM and Y‐27632 as indicated. Images from time‐lapse recording. (D) Fluorescence intensity of GCaMP‐myr in the target cell with (black, the same data with Fig 1E) or without (blue) Y‐27632. Mean (bold line) with standard deviation of the mean (ribbon band, six cells in six embryos).
-
E–GImages from time‐lapse recordings following CaLM (lateral epidermis, stage 7). Target cells marked in blue. (E) Co‐injection of Rho kinase inhibitor Y‐27632. (F) Embryos from RhoGEF2 germline clones. (G) Embryo expressing a Rho sensor, and white arrows indicate the target cell.
-
HCross‐sectional area traces of target cells normalized to initial size (the first frame of recording after uncaging) in embryos from RhoGEF2 germline clone female following CaLM.
-
ICross‐sectional area of target cells normalized to initial size (the first frame of recording after uncaging) in embryos injected with 10 mM Y‐27632 (n = 8 cells in five embryos) following Ca2+ uncaging. Mean (bold line) with standard deviation of the mean (ribbon band).
-
JRho sensor fluorescence in target cells (n = 6 cells in six embryos) following Ca2+ uncaging. Mean (bold line) with standard deviation of the mean (ribbon band).