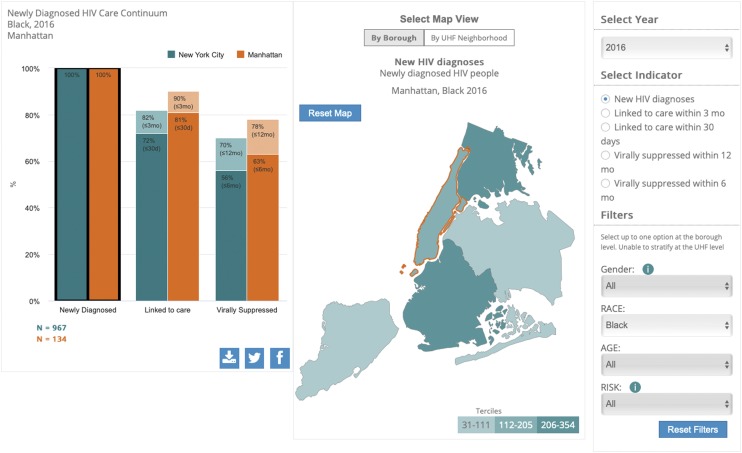
FIGURE 1—
Screen Shot From New York’s Ending the Epidemic (EtE) Dashboard System Showing an Interactive Visualization for Persons With Newly Diagnosed HIV in Manhattan (Orange) Versus the Rest of New York City (Turquoise)
Source. Reproduced with permission from www.etedashboardny.org.

