-
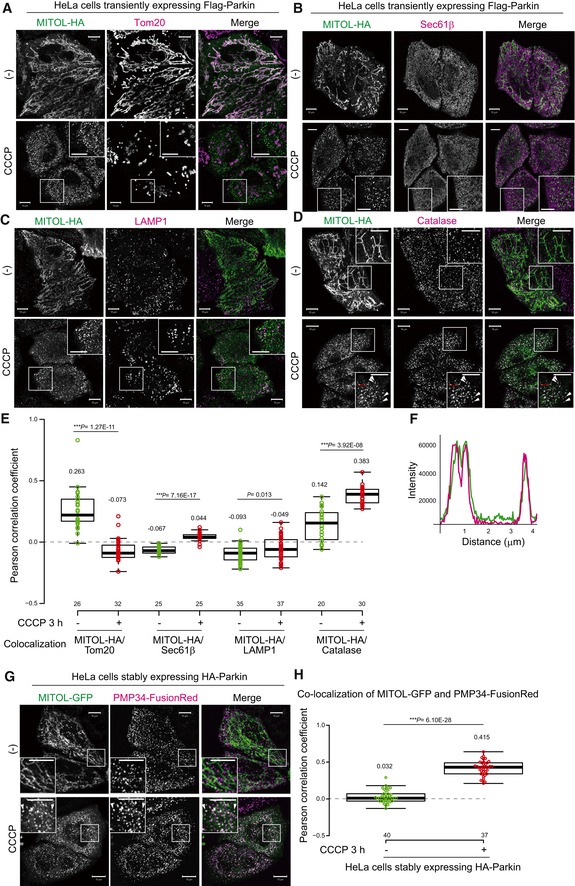
A–C
MITOL‐HA formed small dot‐like structures following CCCP treatment. HeLa cells transiently expressing Flag‐Parkin and MITOL‐HA were treated with 15 μM CCCP for 3 h, and then subjected to immunocytochemistry. MITOL and Tom20 (mitochondrial marker; A) signals co‐localized well without CCCP treatment, whereas the MITOL‐positive small dots were not coincident with Tom20, Sec61β (ER marker; B), or LAMP1 (lysosomal marker; C) after CCCP treatment. Scale bars, 10 μm.
-
D
MITOL‐HA co‐localized with catalase (peroxisome marker) following CCCP treatment. Higher magnification images of the boxed regions are shown in the small panel. Scale bars, 10 μm. Arrowheads indicate representative examples of MITOL‐HA co‐localization with catalase.
-
E
Correlation statistics for the localization of MITOL‐HA and Tom20, Sec61β, LAMP1, or catalase. Dots indicate individual Pearson correlation coefficient data points. In the box‐plots, the center lines indicate the medians, the box limits indicate the 25th and 75th percentiles as determined in the R software package, and the whiskers extend 1.5 times the interquartile range from the 25th and 75th percentiles. Means and the number of samples are shown on the box and X‐axis, respectively. Statistical significance was calculated using a one‐tailed Welch's t‐test.
-
F
The line graph shows a line scan of fluorescence through three MITOL‐positive peroxisomes (red bar in D) that clearly indicates co‐localization of MITOL (green line) and catalase (magenta line).
-
G
Peroxisomal membrane protein (PMP) 34‐FusionRed also co‐localized with MITOL‐GFP in Parkin‐expressing HeLa cells after 3 h of CCCP treatment. Higher magnification images of the boxed regions are shown in the small panel. Scale bars, 10 μm.
-
H
Correlation statistics for the localization of MITOL‐GFP and PMP34‐FusionRed. Dots indicate individual Pearson correlation coefficient data points. In the box‐plots, the center lines indicate the medians, box limits indicate the 25th and 75th percentiles as determined in the R software package, and the whiskers extend 1.5 times the interquartile range from the 25th and 75th percentiles. Means and the number of samples are shown on the box and X‐axis, respectively. Statistical significance was calculated using a one‐tailed Welch's t‐test.