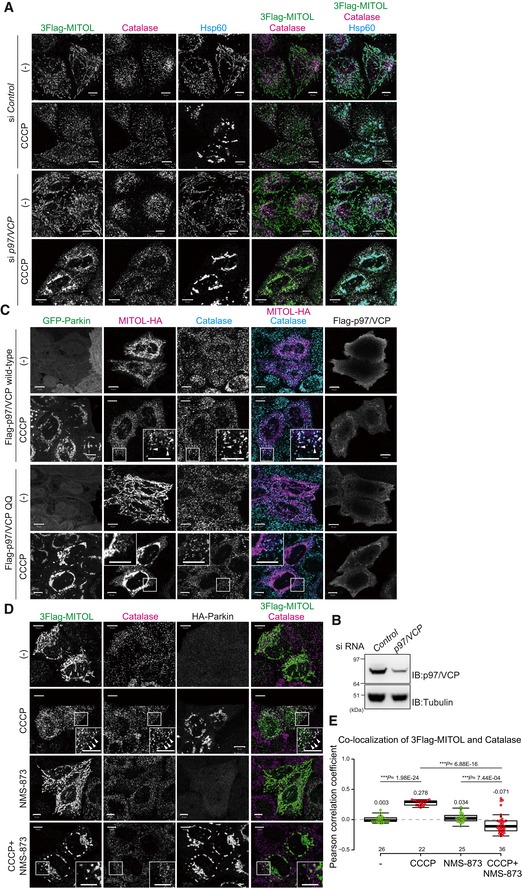
MITOL did not merge with Hsp60 in control siRNA‐treated cells, whereas most MITOL co‐localized with Hsp60 in p97/VCP knockdown cells in response to mitophagy stimuli. HeLa cells stably expressing 3Flag‐MITOL and HA‐Parkin were transfected with control or p97/VCP siRNA, treated with 15 μM CCCP for 3 h, and then subjected to immunocytochemistry with anti‐Flag, anti‐catalase, and anti‐Hsp60 antibodies. Scale bars, 10 μm.
HeLa cell lysates treated with control or p97/VCP siRNA were immunoblotted with anti‐p97/VCP and anti‐tubulin antibodies.
Overexpression of a p97/VCP ATP hydrolysis‐defective mutant, E305Q/E578Q (p97QQ), blocked MITOL redistribution from mitochondria to peroxisomes, while overexpression of wild‐type p97/VCP had no effect on MITOL redistribution. HeLa cells stably expressing GFP‐Parkin were transfected with MITOL‐HA and Flag‐p97/VCP wild‐type or p97QQ, treated with 15 μM CCCP for 3 h, and then subjected to immunocytochemistry with anti‐HA and anti‐catalase antibodies. Higher magnification images of the boxed regions are shown in the small panel. Scale bars, 10 μm.
NMS‐873, a specific inhibitor of p97/VCP, prevented MITOL translocation following CCCP treatment. HeLa cells stably expressing HA‐Parkin were transfected with 3Flag‐MITOL, treated with 15 μM CCCP in the presence or absence of 10 μM NMS‐873 for 3 h, and then subjected to immunostaining with anti‐Flag, anti‐catalase, and anti‐HA antibodies. Higher magnification images of the boxed regions are shown in the small panel. Scale bars, 10 μm. Arrowheads in (C) and (D) indicate representative examples of MITOL–peroxisome co‐localization that was only observed in the presence of a functional VCP.
Correlation statistics for the localization of 3Flag‐MITOL and catalase in the presence of NMS‐873. Dots indicate individual Pearson correlation coefficient data points. In the box‐plots, the center lines indicate the medians, the box limits indicate the 25th and 75th percentiles as determined in the R software package, and the whiskers extend 1.5 times the interquartile range from the 25th and 75th percentiles. Means and the number of samples are shown on the box and X‐axis, respectively. Statistical significance was calculated using a one‐tailed Welch's t‐test.