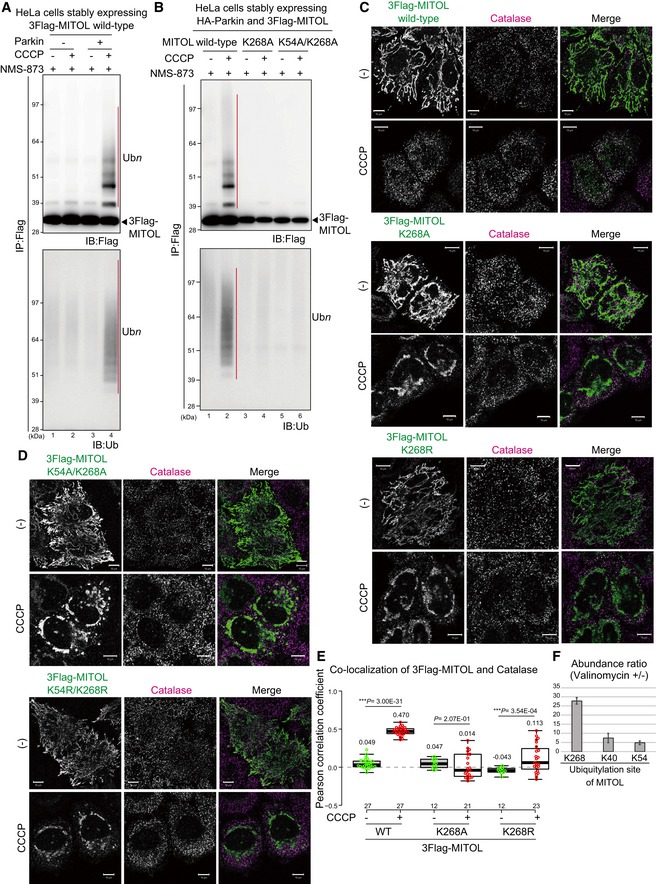
MITOL was ubiquitylated only in the presence of Parkin when the mitochondrial membrane was decreased. After 15 μM CCCP treatment for 3 h, HeLa cells stably expressing HA‐Parkin and 3Flag‐MITOL were immunoprecipitated with anti‐Flag magnetic beads, and then immunoblotted with the indicated antibodies. Red bars indicate ubiquitylation; the black arrowhead indicates 3Flag‐MITOL.
The characteristic ubiquitylation ladder was observed for wild‐type MITOL, but was absent in the K268A and K54A/K268A mutants. Black arrowhead indicates 3Flag‐MITOL.
The MITOL K268A and K268R mutants were targeted to mitochondria under steady‐state conditions, whereas peroxisomal localization following CCCP treatment was considerably disrupted. HeLa cells stably expressing HA‐Parkin were transfected with 3Flag‐MITOL wild‐type, K268A, or K268R mutants, treated with 15 μM CCCP for 3 h, and then subjected to immunostaining with anti‐Flag and anti‐catalase antibodies. Scale bars, 10 μm.
The double K54/K268 mutation did not change the MITOL localization pattern. The subcellular localization of the MITOL K268A or K268R mutants was not drastically changed by inclusion of the K54A or K54R mutations. Scale bars, 10 μm.
Correlation statistics for the localization of 3Flag‐MITOL wild‐type, K268A, or K268R mutants with catalase. Dots indicate individual Pearson correlation coefficient data points. In the box‐plots, the center lines indicate the medians, the box limits indicate the 25th and 75th percentiles as determined in the R software package, and the whiskers extend 1.5 times the interquartile range from the 25th and 75th percentiles. Means and the number of samples are shown on the box and X‐axis, respectively. Statistical significance was calculated using a one‐tailed Welch's t‐test.
The fold change in ubiquitylation of MITOL K268, K40, and K54 in valinomycin‐treated samples versus untreated samples. After 3 h of valinomycin treatment, PEX19
−/− HCT116 cells stably expressing HA‐Parkin and 3Flag‐MITOL were immunoprecipitated with anti‐Flag magnetic beads, and then subjected to LC‐MS/MS analysis for label‐free quantification of ubiquitylated peptides. Error bars represent the mean ± s.e.m. in three biological replicates.