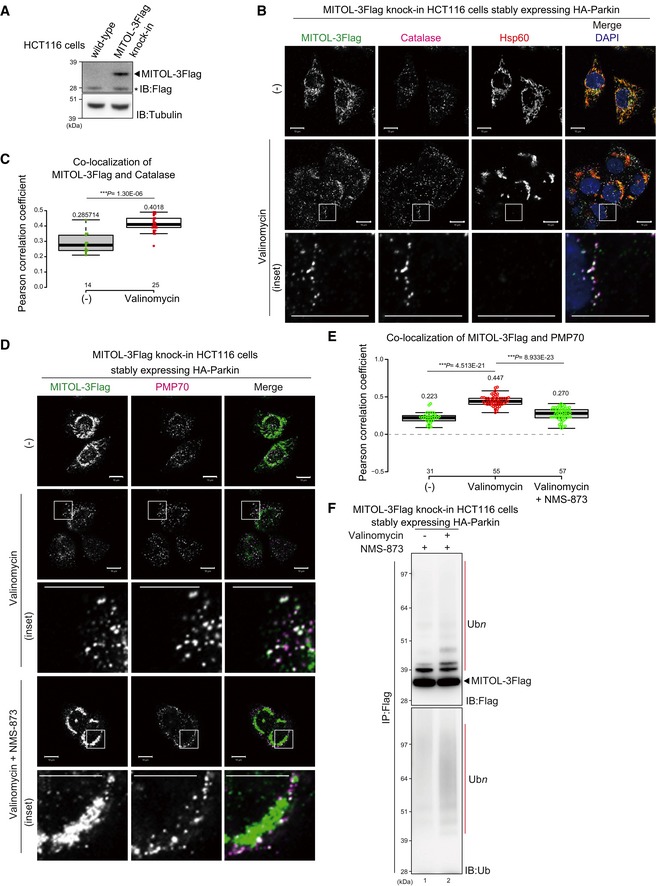
To generate MITOL‐3Flag knock‐in (KI) HCT116 cell lines, 3xFlag gene cassettes were inserted upstream of the MITOL stop codon using CRISPR/Cas9‐based gene editing. Insertion of the 3Flag‐tag was verified by immunoblotting with an anti‐Flag antibody. Asterisk indicates a cross‐reacting band.
The MITOL subcellular localization was observed in MITOL‐3Flag KI HCT116 cells stably expressing HA‐Parkin with anti‐Flag, anti‐catalase, and anti‐Hsp60 antibodies. Endogenous MITOL (detectable with an anti‐Flag antibody) overlapped with Hsp60 under steady‐state conditions, whereas 3 h of valinomycin (10 μM) treatment induced translocation of endogenous MITOL from mitochondria to peroxisomes. Higher magnification images of the boxed regions are shown in the bottom panel. Scale bars, 10 μm.
Correlation statistics for the localization of endogenous MITOL‐3Flag with catalase. Dots indicate individual Pearson correlation coefficient data points. In the box‐plots, the center lines show the medians, box limits indicate the 25th and 75th percentiles as determined by the R software package, and whiskers extend 1.5 times the interquartile range from the 25th and 75th percentiles. Means and the number of samples are shown on the box and the X‐axis, respectively. Statistical significance was calculated using a one‐tailed Welch's t‐test.
The extraction of endogenous MITOL from depolarized mitochondria is blocked by the p97/VCP inhibitor NMS‐873. Higher magnification images of the boxed regions are shown in the lower panel. Scale bars, 10 μm.
Correlation statistics for the localization of endogenous MITOL and PMP70 in the presence of NMS‐873. Dots indicate individual Pearson correlation coefficient data points. In the box‐plots, the center lines show the medians, box limits indicate the 25th and 75th percentiles as determined by the R software package, and whiskers extend 1.5 times the interquartile range from the 25th and 75th percentiles. Means and the number of samples are shown on the box and the X‐axis, respectively. Statistical significance was calculated using a one‐tailed Welch's t‐test.
Endogenous MITOL is ubiquitylated following valinomycin treatment. After MITOL‐3Flag KI HCT116 cells stably expressing HA‐Parkin were treated with valinomycin for 3 h, the collected cell lysates were immunoprecipitated with anti‐Flag magnetic beads. The immunoprecipitates were blotted using anti‐Flag and anti‐ubiquitin antibodies. Red bars indicate ubiquitylation; the black arrowhead indicates MITOL‐3Flag.