
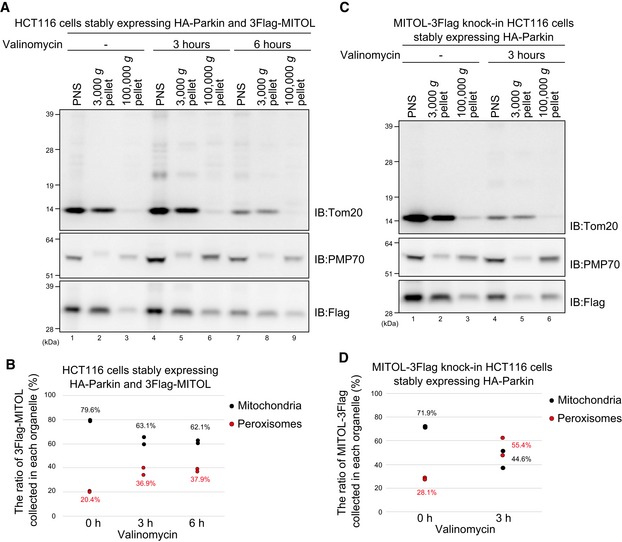
Figure 11. Subcellular fractionation confirms the redistribution MITOL from depolarized mitochondria to peroxisomes.
-
ADistribution of exogenous 3Flag‐MITOL in the mitochondria‐rich or peroxisome‐rich fraction following cellular fractionation. HCT116 cells stably expressing HA‐Parkin and 3Flag‐MITOL were subjected to fractionation and detected using anti‐Tom20, anti‐PMP70, and anti‐Flag antibodies. Tom20 and PMP70 were used as mitochondrial and peroxisomal markers, respectively. The 3,000 g and 100,000 g pellets represent the mitochondria‐rich and peroxisome‐rich fractions.
-
BThe recovery ratio of 3Flag‐MITOL between the mitochondria‐enriched (3,000 g pellet) and peroxisome‐enriched fraction (100,000 g pellet) following valinomycin treatment for the indicated times. The ratio of peroxisome‐localized 3Flag‐MITOL to mitochondria‐localized 3Flag‐MITOL increased with valinomycin treatment for 3 h. Graphic data represent results of two biological replicates. In scatter plot, dots indicate individual data points. Black dots indicate the ratio of 3Flag‐MITOL collected in the mitochondria‐enriched fractions, and red dots are the ratio of 3Flag‐MITOL collected in the peroxisome‐enriched fractions. Mean values are also shown.
-
C, DDistribution of endogenous MITOL in the mitochondria‐rich or peroxisome‐rich fraction following cellular fractionation. The distribution of endogenous MITOL was examined as in (A) and (B) using MITOL‐3Flag knock‐in HCT116 cells. Treatment of cells with valinomycin for 3 h reduced the amount of endogenous MITOL in the mitochondria‐enriched fraction, but concomitantly increased endogenous MITOL in the peroxisome‐enriched fraction. Graphic data represent results of two biological replicates. In scatter plot, dots indicate individual data points. Black dots indicate the ratio of MITOL‐3Flag collected in mitochondria‐enriched fractions, and red dots are the ratio of MITOL‐3Flag collected in the peroxisome‐enriched fractions. Mean values are also shown.