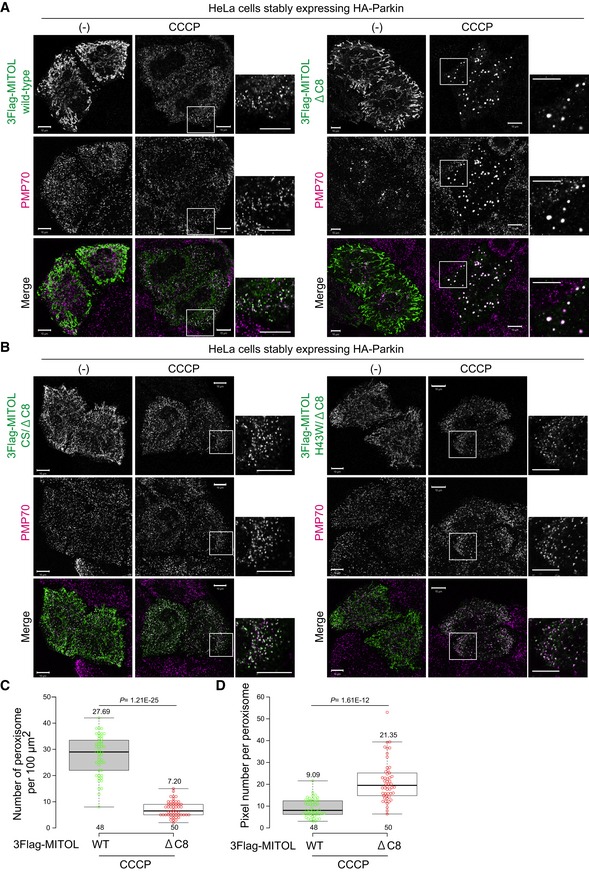
HeLa cells expressing HA‐Parkin and wild‐type 3Flag‐MITOL or 3Flag‐MITOL lacking C‐terminal 8 amino acids (∆C8) were treated with 15 μM CCCP for 3 h, and then subjected to immunocytochemistry with anti‐Flag and anti‐PMP70 antibodies. Expanded peroxisomes were observed in MITOL∆C8‐expressing cells. Higher magnification images of the boxed regions are shown in the small panel. Scale bars, 10 μm.
3Flag‐MITOL∆C8 with the E3‐inactive Cys65Ser/Cys68Ser (CS) and H43W mutations were transfected into HeLa cells stably expressing HA‐Parkin, treated with 15 μM CCCP, and then subjected to immunocytochemistry with anti‐Flag and anti‐PMP70 antibodies. After 3 h of CCCP treatment, both the CS and H43W mutants localized on peroxisomes but expansion was not observed. Scale bars, 10 μm.
HeLa cells expressing HA‐Parkin and MITOL wild‐type or ∆C8 were treated with 15 μM CCCP for 3 h, and the number of peroxisomes was counted as PMP70‐positive dots per 100 μm2. In the box‐plots, dots indicate individual data points, the center lines show the medians, box limits indicate the 25th and 75th percentiles as determined by the R software package, and whiskers extend 1.5 times the interquartile range from the 25th and 75th percentiles. Means and the number of samples are shown on the box and the X‐axis, respectively. Statistical significance was calculated using a one‐tailed Welch's t‐test. The abundance of peroxisomes in cells expressing MITOL∆C8 was significantly decreased as compared with cells expressing wild‐type MITOL.
MITOL∆C8 causes a drastic expansion of peroxisomes following CCCP treatment. HeLa cells expressing HA‐Parkin and wild‐type or ∆C8 MITOL were treated with 15 μM CCCP for 3 h, and the approximate size of peroxisomes was determined as the number of pixels occupied by one peroxisome. The PMP70‐positive pixels per 100 μm2 were divided by the number of peroxisomes in the same area. In the box‐plots, dots indicate individual data points, the center lines show the medians, box limits indicate the 25th and 75th percentiles as determined by the R software package, and whiskers extend 1.5 times the interquartile range from the 25th and 75th percentiles. Means and the number of samples are shown on the box and the X‐axis, respectively. Statistical significance was calculated using a one‐tailed Welch's t‐test.

