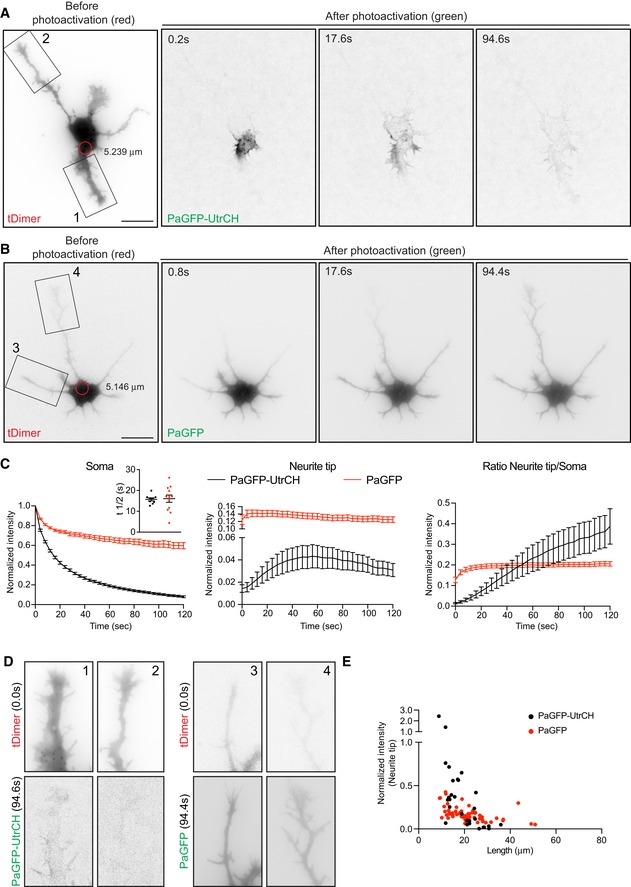
Figure 2. Somatic F‐actin puncta act as rapid supply sources of F‐actin to the periphery in developing neurons.

- PaGFP‐UtrCH and tDimer co‐transfected DIV1 rat hippocampal neuron photoactivated in the soma with 405 nm laser (red circle with a diameter of 5.239 μm).
- PaGFP and tDimer co‐transfected DIV1 rat hippocampal neuron photoactivated in the soma with 405 nm laser (red circle with a diameter of 5.146 μm).
- Left panel: normalized intensity values in the photoactivated area of PaGFP‐UtrCH and PaGFP expressing cells. Inset graph: half‐time (t½) values in seconds for PaGFP‐UtrCH cells = 15.71 ± 0.712 (n = 9), PaGFP cells = 16.06 ± 1.755 (n = 12). Middle panel: photoactivated signal in growth cones over time relative to the average initial signal from illuminated area for PaGFP‐UtrCH and PaGFP expressing cells. Right panel: Growth cone to soma photoactivated signal intensity ratio of PaGFP‐UtrCH and PaGFP expressing cells. All graphs: mean ± SEM; n = 9 cells for PaGFP‐UtrCH, n = 12 cells for PaGFP from at least three different cultures.
- Neurites from cells in (A; insets 1, 2) and (B; insets 3, 4) show the reach of the photoactivated signal at 94.4 s of the time lapse.
- Normalized intensity values from the growth cones plotted against their neurite lengths of PaGFP‐UtrCH and PaGFP expressing cells 120 s after photoactivation.
