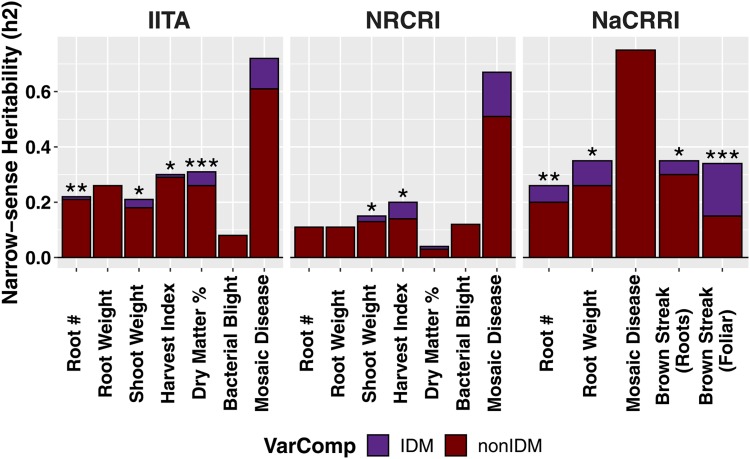
Figure 4.
Heritability accounted for by introgressions. The heritability (y-axis) of introgression regions for each trait (x-axis) measured in each breeding program (horizontal panels). Heritability was estimated from partitioned genomic mixed-models and the portion of heritability attributable to introgression regions (purple) vs. the rest of the genome (dark red) is shown. Stars atop bars represent the level of significance in a likelihood ratio test for the significance of the introgression-component (***P < 0.0001, **P < 0.001, *P < 0.05).

