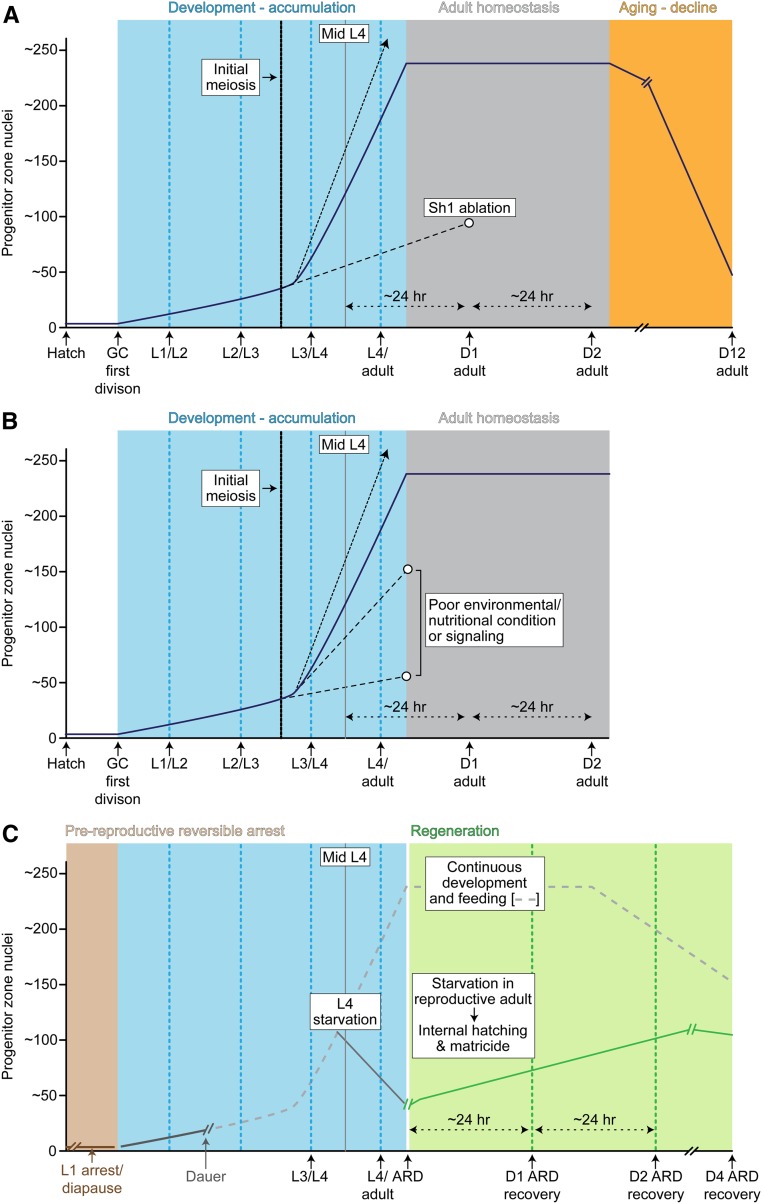
Figure 7.
Dynamic changes in the germline stem cell system during development and adulthood and in altered environments. Approximate number of progenitor zone (PZ) nuclei per gonad arm over time. (A) PZ accumulation in standard laboratory conditions. Solid line: PZ accumulation in larval stages, homeostasis in early adult, and decline in aging. Dashed line: PZ accumulation after Sh1 (distal sheath cell pair) ablation. (B) Comparison of PZ accumulation in standard laboratory conditions (solid line) vs. poor conditions or reduced nutrient signaling (dashed lines). In A and B, time of initial meiosis and estimated trajectory for total PZ cells produced (including cells that enter meiotic prophase starting in the mid-L3; Berry et al. 1997) is represented by the dotted arrow. (C) Comparison of PZ accumulation in continuous development vs. developmental arrest (L1 arrest/diapause, dauer, and ARD; see text). L1, L2, etc. indicates first, second, etc. larval stages; D1, D2, etc. indicates adult age progression, e.g., “day 1” adult. Color code: blue, accumulation phase; gray, homeostasis; orange, decline; tan, continued quiescence; green, regrowth after ARD arrest and recovery. ARD, adult reproductive diapause; GC, germ cell.

