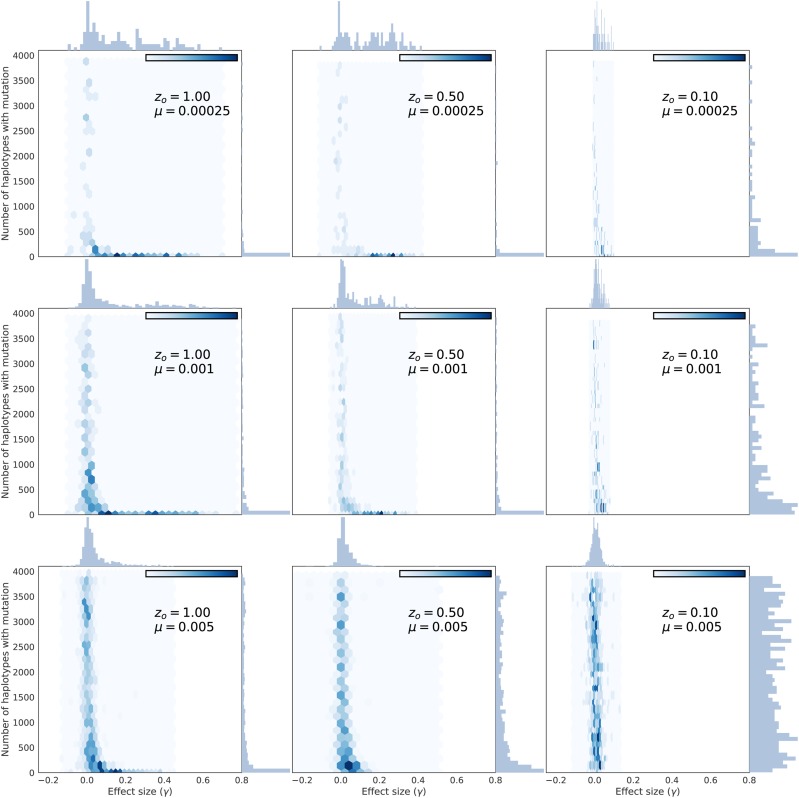
Figure 9.
The number of haplotypes associated with fixations from standing variation of different effect sizes. Each panel shows the effect size of a fixation from standing variation (x-axis) and the number of unique haplotypes in the entire population containing that mutation. The number of haplotypes for each mutation is taken immediately prior to the optimum shift and excludes any mutations that arose that generation. Thus, all mutations found on a single haplotype are more than one generation old.

