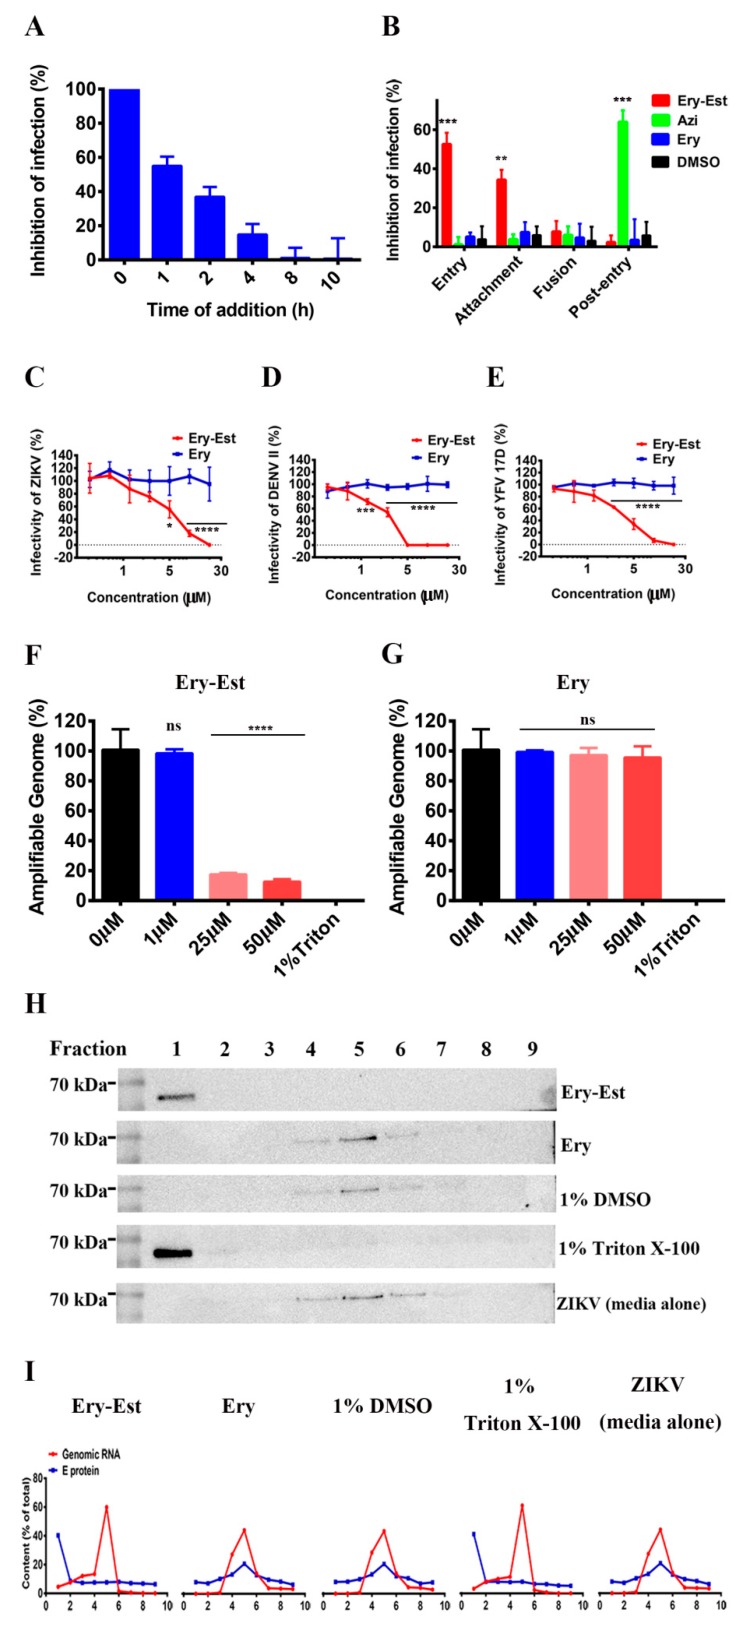
Figure 3.
Early stages of ZIKV infection were inhibited by Ery-Est. (A) BHK21 cells (2 × 10⁶) were infected with ZIKV SZ01 and Ery-Est was added at different time points post infection. Plaque assay was used to detect viral infection. (B) The experimental scheme of viral lifecycle. In the entry experiment, cells were infected with ZIKV SZ01 in the presence of Ery-Est, Azi, Ery, or DMSO at 37 °C for 1 h, and then the unbound viruses and drugs were washed and removed. In the attachment experiment, virus infected cells were presented with Ery-Est, Azi, Ery, or DMSO at 4 °C for 1 h, allowing viral attachment but not membrane fusion due to the low temperature, and washed to remove the unbound viruses and drugs. In the fusion assay, cells were first infected with virus at 4 °C for 1 h for viral attachment and washed to remove the unbound viruses, then incubated in the presence of Ery-Est, Azi, Ery, or DMSO at 37 °C for 1 h to allow virus fusion, and unbound drugs were finally removed. In the post-entry experiment, cells were first infected with virus at 37 °C for 1 h to allow virus entry into cells and washed to remove unbound viruses, then Ery-Est, Azi, Ery, or DMSO was added to infected cells for 12 h. Viral infection of those four experiments were evaluated by plaque assay. (C) ZIKV, (D) DENV II, and (E) YFV 17D were respectively treated by Ery-Est at 37 °C for 2 h, after being separated from Ery-Est by PEG-8000, and the viruses were measured for their infectivity. Degradation of released genomic RNA of ZIKV treated by (F) Ery-Est or (G) Ery in an RNase digestion assay. The genomic RNA coding E protein was detected. The separation of E protein and of ZIKV treated by Ery-Est, Ery, 1% DMSO, and Triton X-100 or with media alone through a sucrose density gradient assay. E protein in each fraction was assessed by (H) Western blot and each percent was analyzed by Image J software and then calculated. (I) Genomic RNA in each fraction was separated and each percent of total RNA genome was measured by RT-qPCR. For (A) to (G), the experiments were tested in triplicate and data are represented as means ± SD. Each experiment was repeated at least twice and similar results were obtained. Statistical analysis: unpaired Student’s t test for (B); two-way ANOVA with Sidak’s multiple comparisons for (C–E); one-way ANOVA with Dunnett’s multiple comparisons for (F) and (G). ns = not significant. * p < 0.05; ** p < 0.01; *** p < 0.001. **** p < 0.0001.

