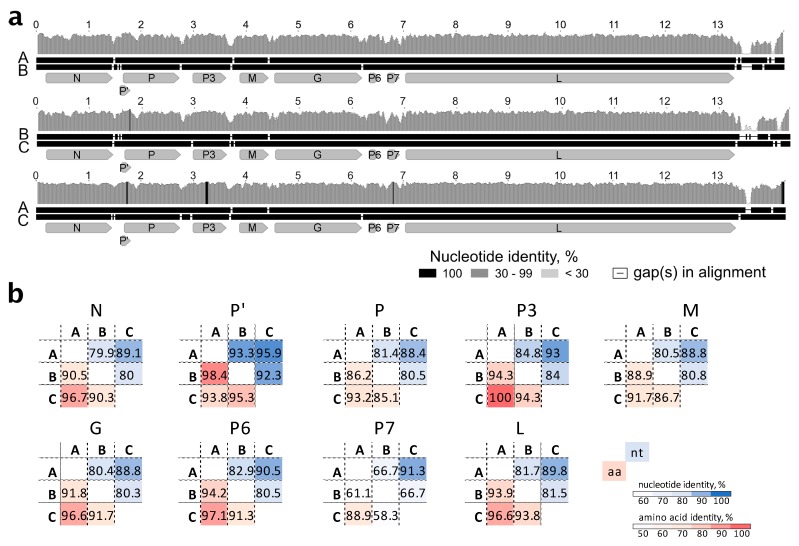
Figure 4.
(a) Representation of pairwise nt alignments between different genomic genotypes of StrV-1-ČRM1. The vc strands were aligned. Gap regions in alignments are shown as lines. A shade legend of nt identities is shown in the lower right corner. Nucleotide positions are shown above each alignment; (b) Sequence nt and aa identities between individual genes and putative proteins of three StrV-1-ČRM1 genotypes.

