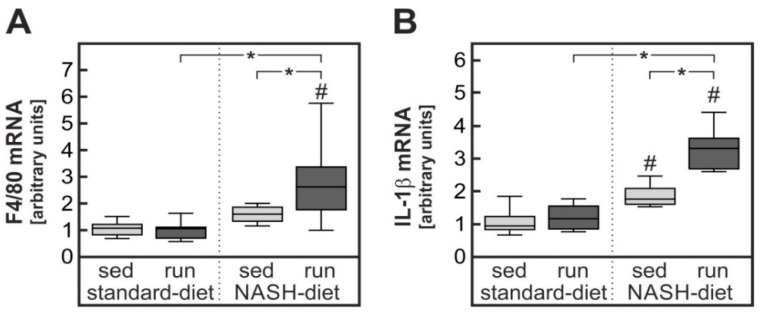
Figure 4.
Enhanced inflammatory response in livers of NASH-diet fed trained rats. Rats were subjected to the different treatment groups described in the legend to Figure 1. The mRNA expression of F4/80 (gene name Adgre1, (A)) and Interleukin-1β (IL-1β, (B)) were quantified by RT-qPCR. Values are median (line), upper and lower quartile (box) and extremes (whiskers). Statistics: Two-way-ANOVA with Tukey’s post hoc test for multiple comparisons; #: significant versus sedentary standard-diet group, * p < 0.05 between compared groups.

