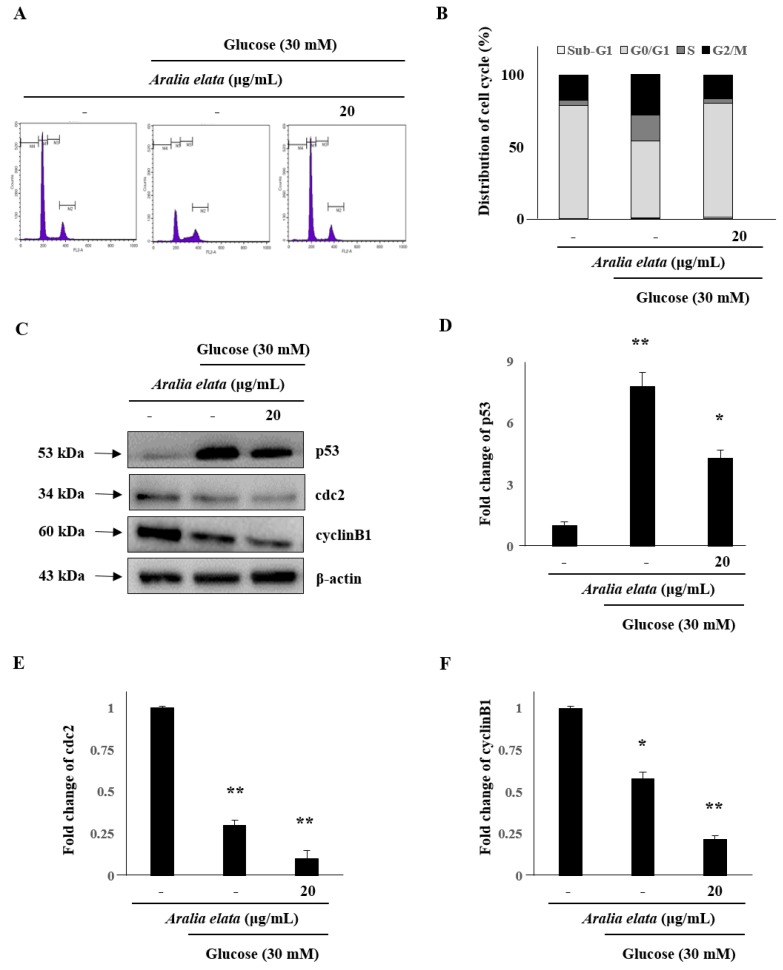
Figure 5.
Effect of AS on cell cycle distribution in HUVECs. (A) Representative fluorescence-associated cell sorting plots describing cell cycle phases. (B) Percentage of cells in different cell cycle phases after HG and AS treatment. Data represent the mean ± SD of five independent experiments. (C) Western blot analysis of p53, cdc2, and cyclin B1 levels. (D–F) Quantification of p53, cdc2, and cyclinB1 levels relative to β-actin. * p < 0.05; ** p < 0.01 vs. the control group.

