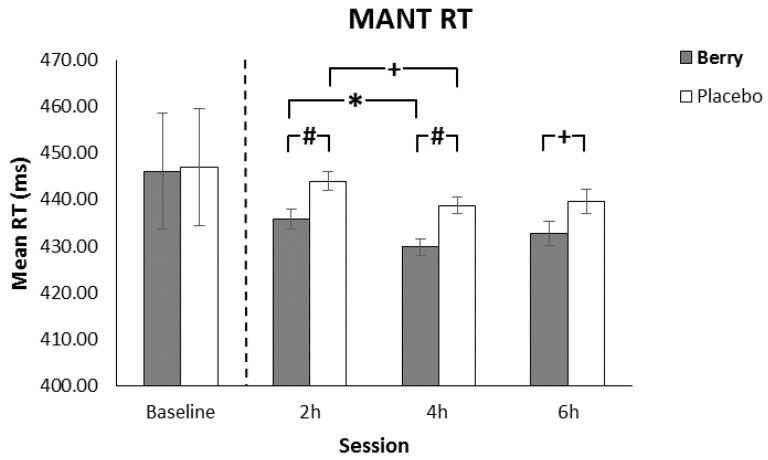
Figure 4.
Reaction time (± SE of the mean) as a function of intervention and session, showing significantly faster berry performance at 2 and 4 h in comparison to the placebo and a significantly faster berry performance between 2 and 4 h. Note there was a trend towards significance at 6 h for faster berry performance in comparison to the placebo and a trend for faster placebo performance between 2 and 4 h. Baseline performance, included as a covariate in the analysis, is shown separated by the dotted line. + p < 0.1, * p < 0.05, # p < 0.01.

