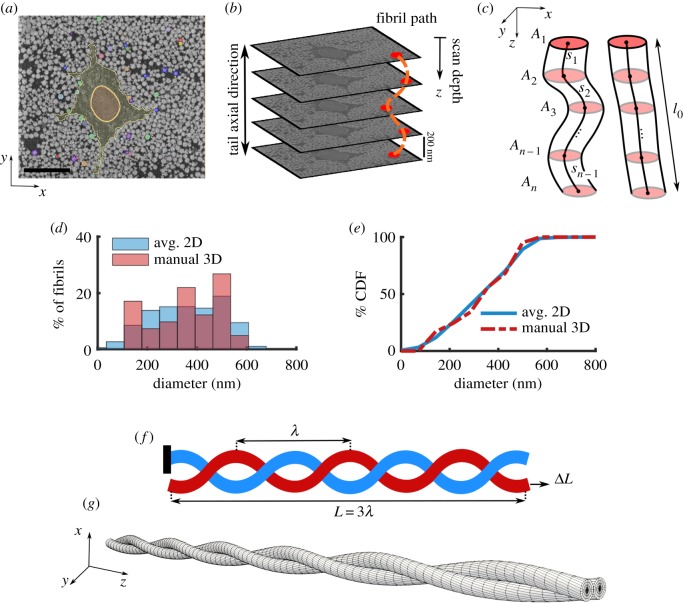
Figure 1.
(a) Representative SEM image and in-plane segmentation (scale bar, 5 µm), (b) SBF-SEM imaging process showing sequential stacks of images and a schematic fibril label (dotted orange line) along the tendon length, (c) schematics of fibrils with large (left) and low (right) tortuosity that shows the cross-sectional area (Ai) of fibrils throughout the scan depth and the incremental distance (si) between the centre of the fibrils. By comparing the (d) distribution and (e) cumulative distribution function (CDF) of the diameter using the averaged 2D automatic segmentation of all fibrils (blue) and the 3D manual segmentation of a subset of 42 fibrils (red), it is evident that the manually segmented fibrils are a representative of the full fibril population. (f) For the FE analysis, a model with three full turns is used (L = 3λ). The boundary condition is that one fibril (blue) is anchored (left), while the other fibril (red) is pulled in the axial direction (arrow, right) to a deformation of ΔL = Lε. (g) The mesh used for the FE simulations shows that the fibrils were initially in contact throughout the length. (Online version in colour.)

