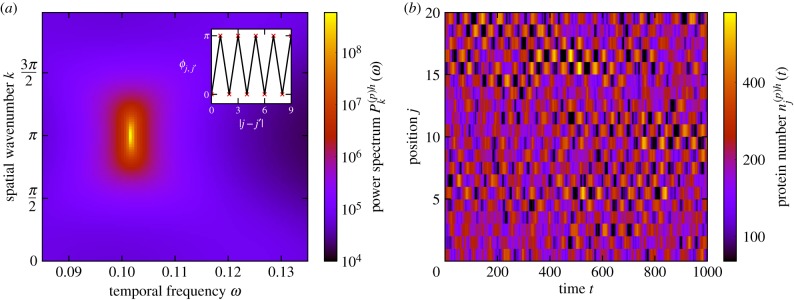
Figure 10.
Neighbouring cells oscillating in anti-phase (standing waves). (a) The power spectrum of fluctuations and the corresponding phase lag between cells at peak frequency as a function of separation (inset). Neighbouring cells tend to oscillate in anti-phase with one another, as demonstrated by the phase lag (inset) and also by the location of the peak of the power spectrum at k = π and non-zero ω. (b) An example of noise-induced standing waves seen in simulations of the stochastic individual-based model. The peaks in one cell tend to align with the troughs in the neighbouring cell, giving rise to chequerboard-type patterns in the figure. The coupling between cells is symmetric (d(+) = d(−) = 1). The remaining system parameters are the same as in figure 2 with the exception that , , τ(m)h = 20 in all cells and τ(m)d = 20. (Online version in colour.)

