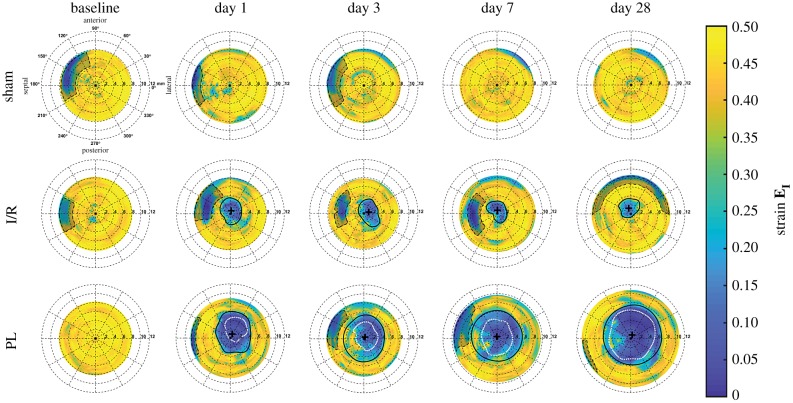
Figure 5.
Longitudinal bullseye maps of the maximum principal 3D Green–Lagrange strain (EI) within the myocardium. Strain-estimated infarct boundaries are outlined in solid black lines with infarct centres marked as black crosshairs. Wall-thinned infarct boundaries measured from segmentation are outlined as white dotted lines, while sternal artefacts are outlined as black dashed lines. (Online version in colour.)

