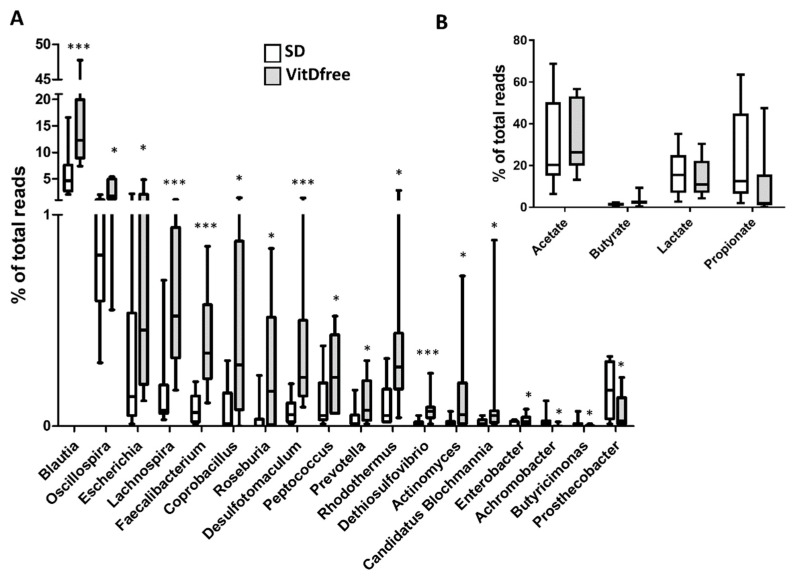
Figure 6.
Effects of vitamin D-free diet on the relative genera abundance. (A) The most significant changes at the genus level are shown as a percent of total reads and represented in a box and whiskers plot for the standard diet (SD, n = 10) and vitamin D-free diet group (n = 10). (B). The relative proportions of acetate, butyrate, lactate and propionate producing bacteria in the gut microbiota. Sequence reads were classified according to the primary end product of the assigned bacterial genera. Genera were classified into more than one group correspondingly if they were defined as producers of multiple metabolites. Results were compared by student’s t-test; * p < 0.05 and *** p < 0.001 vs. SD.

