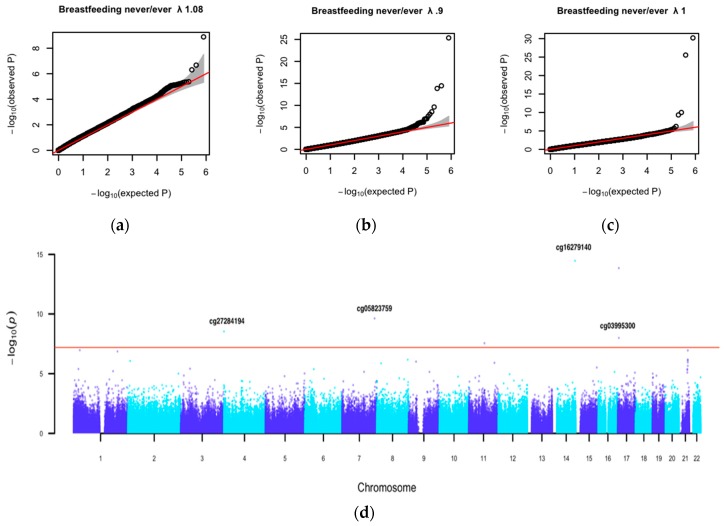
Figure 2.
Quantile-Quantile (QQ) plots: (a) in the total sample; (b) in the subsample of children younger than 10 years old; and (c) in the subsample of children older than 10 years old. (d) Manhattan plot shows the epigenome-wide association study results of breastfeeding ‘never’/‘ever’ in children younger than 10 years old. Covariates included sex, age, socio-economic status (SES), maternal age at delivery, maternal pre-pregnancy BMI, maternal prenatal smoking, gestational age, EPIC array row and bisulfite sample plate, and cell composition. In the Manhattan plot, the red line represents the Bonferroni threshold (6.34 × 10⁻⁸). Given CpG names indicate significant loci after removal of outliers.

