Figure 1.
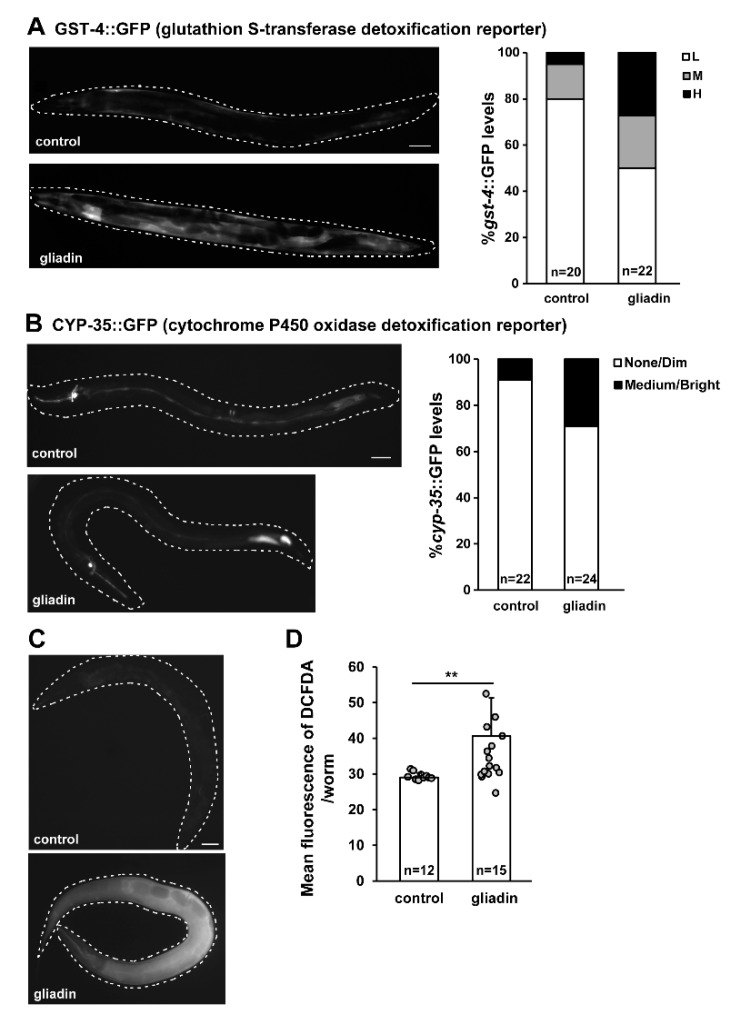
Gliadin intake-induced glutathione S-transferase 4 (GST-4), cytochrome P450 oxidase (CYP-35), and reactive oxygen species (ROS) production in adult-stage Caenorhabditis elegans worms. (A) Pgst-4::GFP transgenic populations synchronized at the L4 larval stage were treated with gliadin for 24 h at 20 °C. Pictures show representative images of Pgst-4::GFP expression after 24 h of gliadin treatment. The bar graph (right panel) shows quantified induction levels of the Pgst-4::GFP reporter in the intestine categorized as low (L), medium (M), and high (H) based on a previously established scale [31]. Scale bar, 100 μm. (B) cyp-35::GFP transgenic populations synchronized at the L4 larval stage were treated with gliadin for 24 h at 20 °C. Pictures show representative images of cyp-35::GFP expression after 24 h of gliadin treatment. The bar graph shows the distribution of GFP expression levels after gliadin treatments. Scale bar, 100 μm. (C) Wild-type N2 animal populations synchronized at the L4 larval stage were treated with gliadin or left untreated as controls. ROS production was measured by 2′,7′-dichlorodihydrofluorescein diacetate (DCFDA) staining after 24 h of treatment. Pictures show representative images of ROS production after treatment as visualized by DCFDA staining (left panels). (D) Bar graph showing pixel intensities from DCFDA fluorescence per worm. Error bars represent s.d. **p < 0.005 (Student’s t-test).

