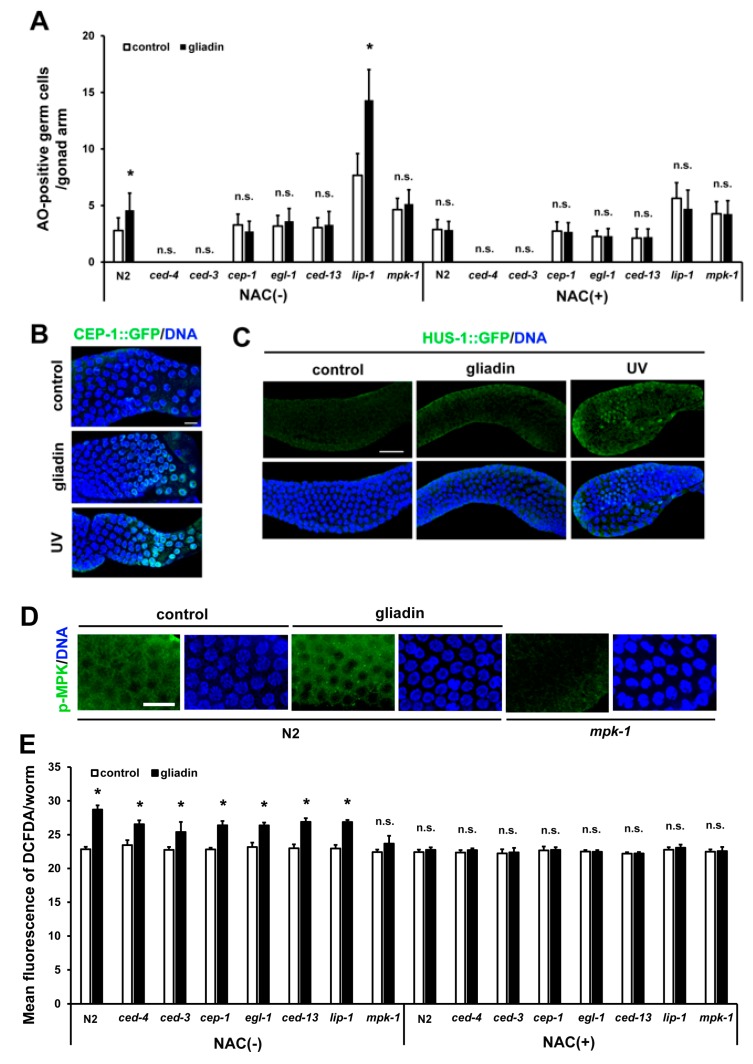
Figure 8.
Effects of CEP-1 activity and mitogen-activated protein kinase (MAPK) signaling on gliadin-induced germ cell apoptosis (GIGA) in adult C. elegans worms. (A) Average numbers of acridine orange (AO)-positive germ cells per gonad arm in wild-type N2, ced-4, ced-3, cep-1, egl-1, ced-13, lip-1, and mpk-1 mutants (n = 30–40 per group) after gliadin treatment for 24 h of treatment with N-acetyl-L-cysteine (NAC) (+) or without NAC (–) starting at the L4 larval stage. (B) CEP-1::GFP was observed by immunostaining in CEP-1::GFP transgenic animals (n = 30 per group) fed with or without gliadin for 24 h starting in the L4 larval stage. UV-treatment condition was used as a positive control. Bar, 10 μm. (C) HUS-1::GFP transgenic animals (n = 30 per group) were synchronized at the L4 stage then treated with or without gliadin. HUS-1::GFP aggregates were observed after UV-treatment (positive control) by immunostaining using an anti-GFP antibody. Bar, 20 μm. (D) Phospho-MPK was observed by immunostaining using an anti-Phospho-p44/42 MAPK antibody in wild-type N2 worms (n = 32 per group) after gliadin treatment for 24 h starting during the L4 larval stage. Bar, 10 μm. (E) Wild-type N2, ced-4, ced-3, cep-1, egl-1, ced-13, lip-1, and mpk-1 mutants (n = 30–40 per group) after gliadin treatment for 24 h treated with NAC (+) or without NAC (–) starting at the L4 larval stage. Reactive oxygen species (ROS) production was measured by 2′,7′-dichlorodihydrofluorescein diacetate (DCFDA) staining. The bar graph shows the pixel intensities from DCFDA fluorescence per worm. Error bars represent s.d.; n.s., not significant. * p < 0.05 (Student’s t-test).

