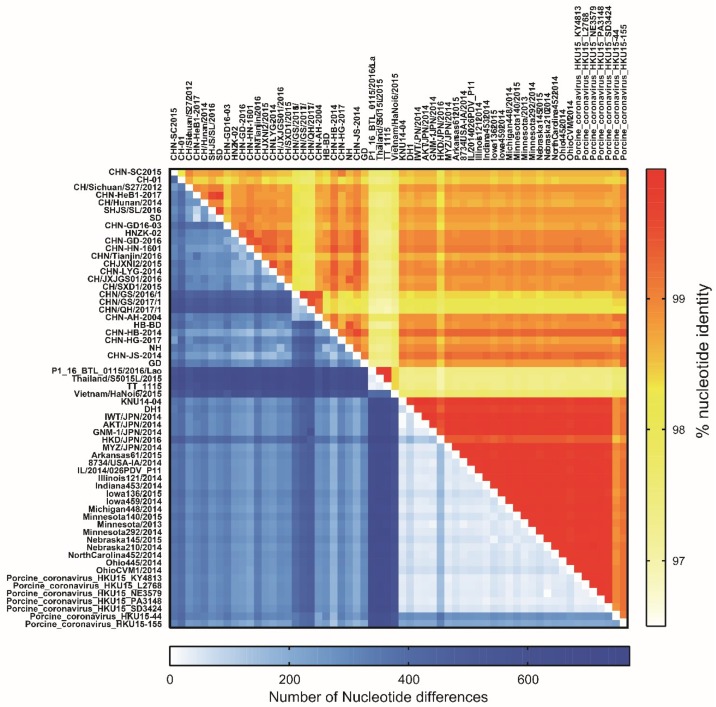
Figure 4.
Heat map of nucleotide identities and differences between CHN-SC2015 and 59 reference strains in GenBank. The level of nucleotide identity (top right) and the number of nucleotide differences (bottom left) between CHN-SC2015 and other 59 reference strains were analyzed using Clustal W software in MEGA X. The nucleotide identity and difference are represented by a gradation of color; the deeper the color, the greater the identity or difference.

