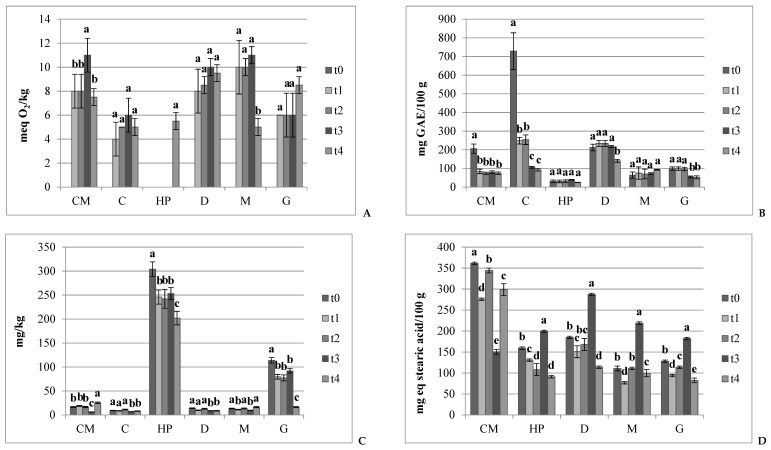
Figure 1.
Evolution of the lipid and phenolic matrix at t0, t1, t2, t3, and t4 of (A) Peroxide values (expressed as meq of O2/kg); (B) Unoxidized polyphenol concentration (expressed as mg of GAE per 100 g); (C) Vitamin E concentration (mg/kg); (D) Acidity values (expressed as mg of stearic acid equivalents per 100 g). Data represent the mean ± SD (n = 3). Within each sample, different letters indicate statistically different values among times according to a post-hoc comparison (Tukey’s test) at p ≤ 0.05.

