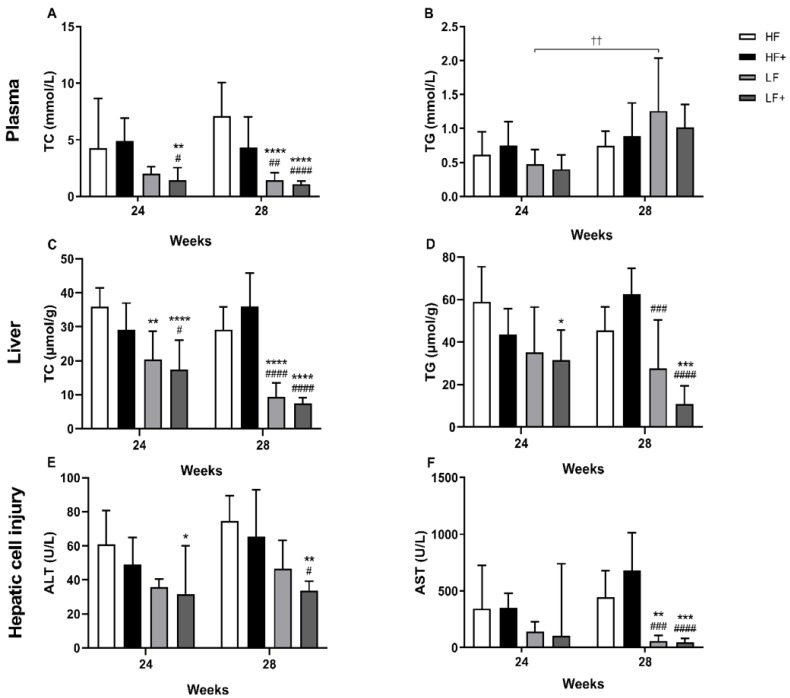
Figure 2.
Evaluation of plasma and hepatic TC and TG levels and status of hepatic cell injury. (A) LF+ were significantly decreased compared with HF and HF+ after 24 weeks. After 28 weeks, both LF and LF+ were significantly reduced compared with HF and HF+. (B) The level of TG in the LF group significantly increased over time. No further differences were detected between groups, although data indicate an increase in TG level in both LF and LF+ over time. (C) Within 24 weeks, LF and LF+ showed significantly reduced TC levels compared with HF. Furthermore, LF+ were also significantly reduced compared with HF+. After 28 weeks, LF and LF+ were significantly reduced compared with HF and HF+. (D) The LF+ group showed decreased TG levels compared with HF after 24 weeks and decreased TG levels compared with HF and HF+ after 28 weeks. The LF group were significantly reduced compared to HF+ after 28 weeks. (E) Reduced levels of ALT were detected in the LF+ group compared with HF after 24 weeks and compared with HF and HF+ after 28 weeks. (F) Both LF and LF+ displayed reduced AST levels compared with HF and HF+ after 28 weeks. Plasma TC and TG; Liver TC and TG, data are presented as mean ± standard deviation. ALT; AST, data are presented as geometric mean with 95% confidence intervals. * p < 0.05, ** p < 0.01, *** p < 0.001, **** p < 0.0001, compared with HF # p < 0.05, ## p < 0.01, ### p < 0.001, #### p < 0.0001, compared with HF+ †† p < 0.01, LF Week 28 compared with LF Week 24. TC, total cholesterol; TG, triglyceride; ALT, alanine aminotransferase; AST, aspartate aminotransferase.

