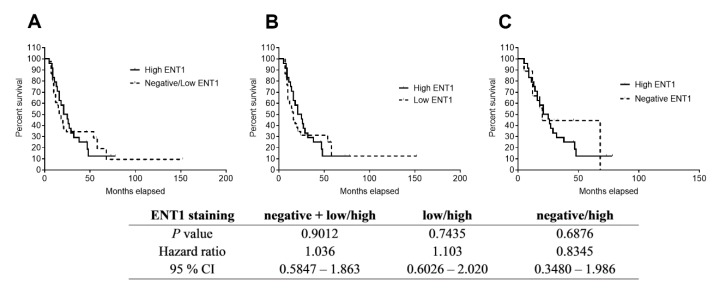
Figure 4.
Kaplan–Meier curves showing differences in DSS based on immunohistochemical expression of ENT1. Patients (n = 63) were divided according to histoscore (see Methods section) into three groups with negative (n = 9), low (n = 30), and high (n = 24) protein expression of ENT1. Statistical significance was evaluated by applying log-rank test analysis between subgroups with (A) high and negative/low ENT1 expression, (B) subgroups with high and low ENT1 expression, and (C) subgroups with high and negative ENT1 expression. No significant association of ENT1 expression with patients’ DSS was observed.

