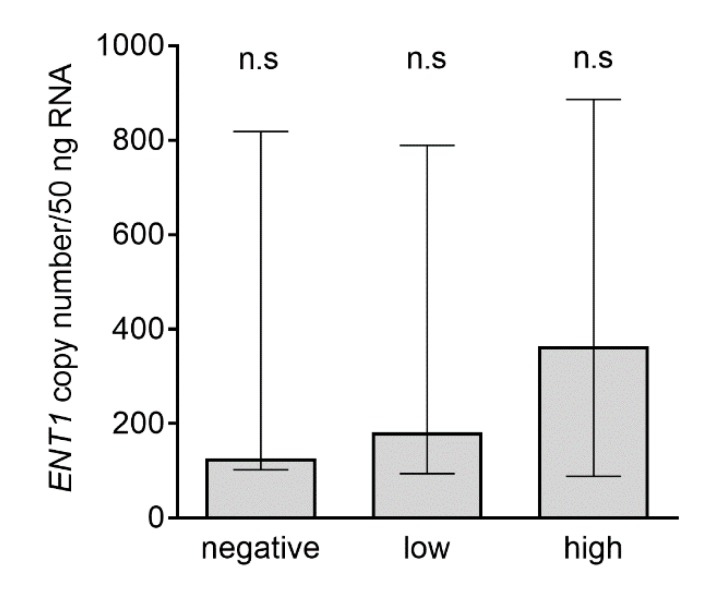
Figure 5.
Analysis of ENT1 transcripts in subgroups with negative, low, and high ENT1 protein expression. Patients were divided based on histoscore of ENT1 expression (and denoted negative (n = 9), low (n = 30) or high (n = 24)); see Methods section. Data are presented as median with interquartile range. Differences in the number of transcripts among subpopulations were analyzed using the nonparametric Kruskal–Wallis test, followed by Dunn’s multiple comparison; n.s., not significant.

