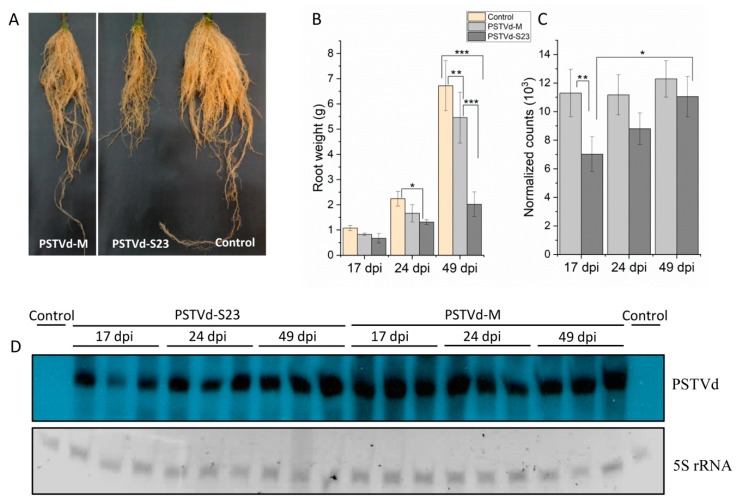
Figure 1.
Potato spindle tuber viroid (PSTVd) infection in tomato roots. (A) Root comparison at 49 dpi. (B) Root weight at the indicated time points. Each bar represents the arithmetic mean of the weight of three roots with the standard deviation indicated. (C) Relative levels of viroid RNA as estimated using the Nanostring nCounter method and nSolver analysis software. The data is presented in arbitrary units compared to control plants. (D) Northern blots that show the presence of PSTVd in infected roots at the indicated time points. Two µg total RNA were separated in 5% polyacrylamide gel with 8 M urea. One-way analysis of variance followed by Tukey’s honest significant difference test was used to determine statistically significant differences. * p < 0.05; ** p < 0.01; *** p < 0.001.

