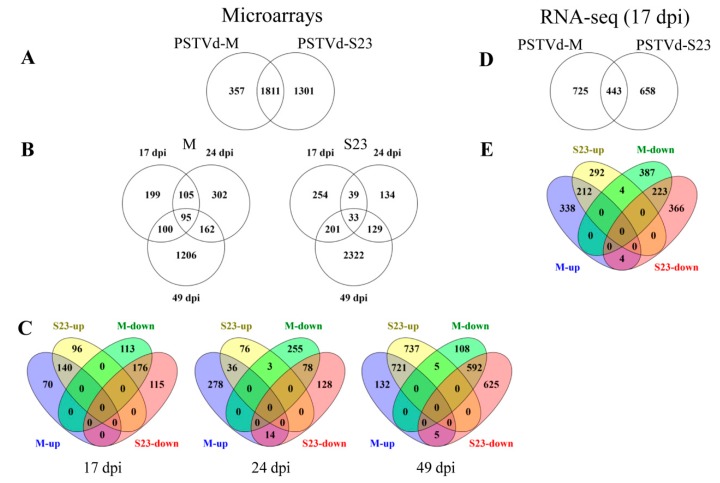
Figure 2.
The number of differentially expressed genes (DEGs) identified in microarray (A–C) and RNA-seq analysis (D,E). Venn diagrams display the distribution of: (A) Total DEGs in M- and S23-infected roots, (B) and at 17, 24 and 49 dpi. (C) Up- and down-regulated genes observed at the indicated time points. (D) Total DEGs at 17 dpi. (E) Up- and down-regulated genes at 17 dpi.

