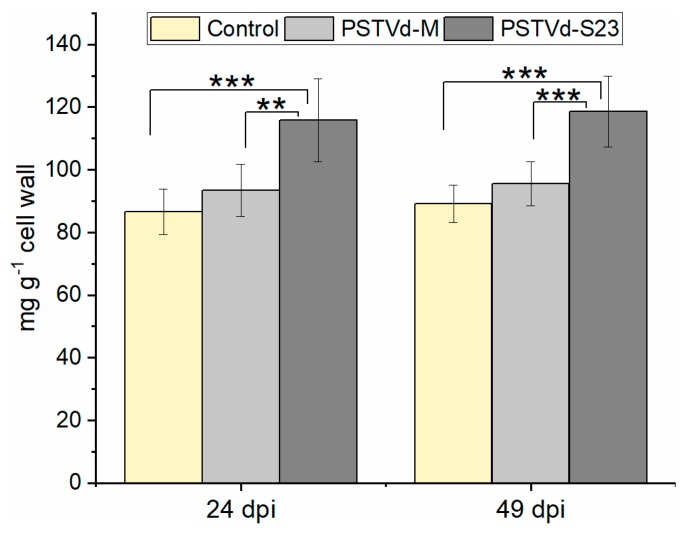
Figure 6.
Lignin content in roots at 24 and 49 dpi. One-way analysis of variance, followed by Tukey’s honest significant difference test, was performed to determine the significance of the differences; ** p < 0.01, *** p < 0.001. Each bar represents the arithmetic mean of the lignin amount from three roots with the standard deviation indicated.

