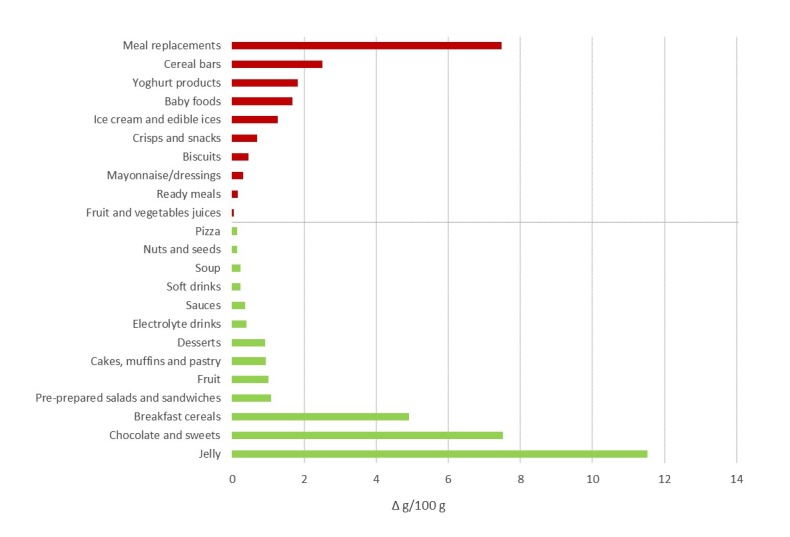
Figure 2.

Trends in sales-weighted mean free sugar content (g/100 g or mL) in selected food categories between 2015 and 2017. The red bars indicate the increases in mean free sugar content in 2017 compared to 2015, while green show the decreases.

Trends in sales-weighted mean free sugar content (g/100 g or mL) in selected food categories between 2015 and 2017. The red bars indicate the increases in mean free sugar content in 2017 compared to 2015, while green show the decreases.