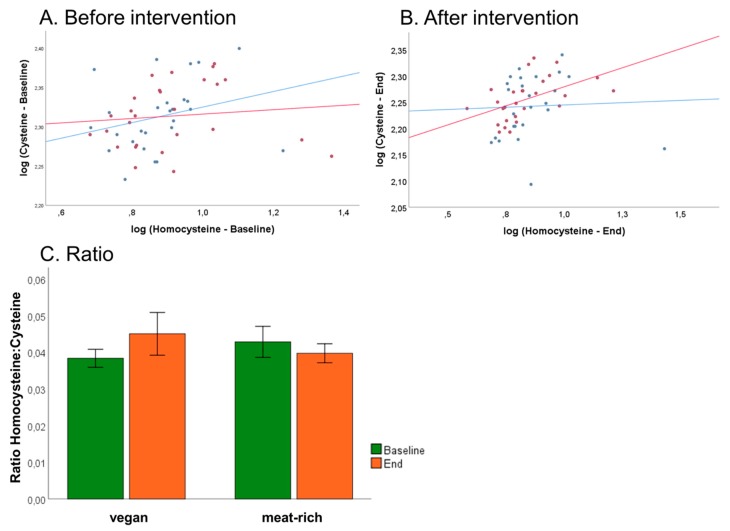
Figure 7.
Associations of total cysteine and total homocysteine and influence of diet on B-vitamin status of VD (blue) and MD (red). (Panel A) Correlation of log of total cysteine and log of total homocysteine before trial. (Panel B) Correlation of log of total cysteine and log of total homocysteine after trial. (Panel C) Assessment of B-vitamin status using the tHcy:tCys ratio proposed by Ulvik et al. [17] at baseline and after 4-week intervention, sorted by assigned diet. Ratio shows non-significantly decrease in vegan group and non-significantly increase in meat-rich group, sorted by time (green baseline, orange end); error bars show ± 1 standard error.

