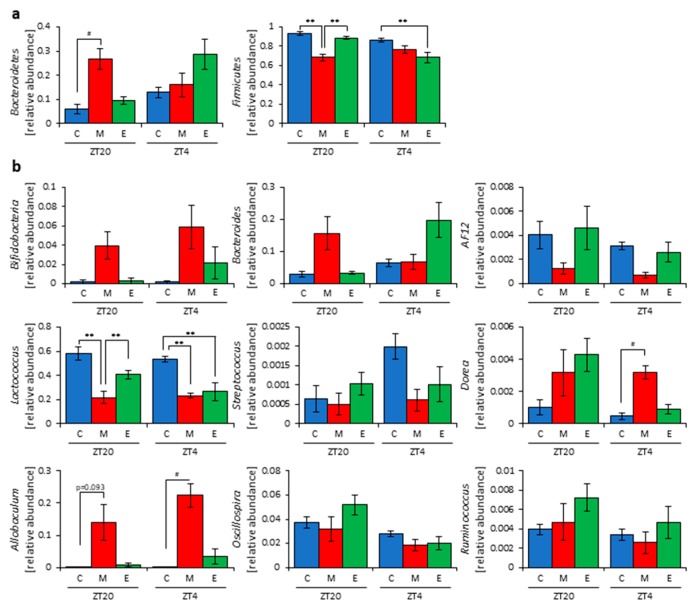
Figure 4.
Morning inulin feeding changed the relative abundance of some bacteria. (a) Phylum level. (b) Genus level. All values are represented as mean ± SEM (cellulose at ZT20 (n = 5) and 4 (n = 5); morning inulin at ZT20 (n = 5) and 4 (n = 5); evening inulin at ZT20 (n = 5) and 4 (n = 5)). ** p < 0.01, evaluated using the two-way ANOVA with Tukey’s post hoc test. # p < 0.05, evaluated using the Kruskal–Wallis test with Dunn post hoc test with a two-stage linear step-up procedure of the Benjamini, Krieger, and Yekutieli test for multiple comparisons. Cellulose, morning inulin, and evening inulin are C, M, or E, respectively.

