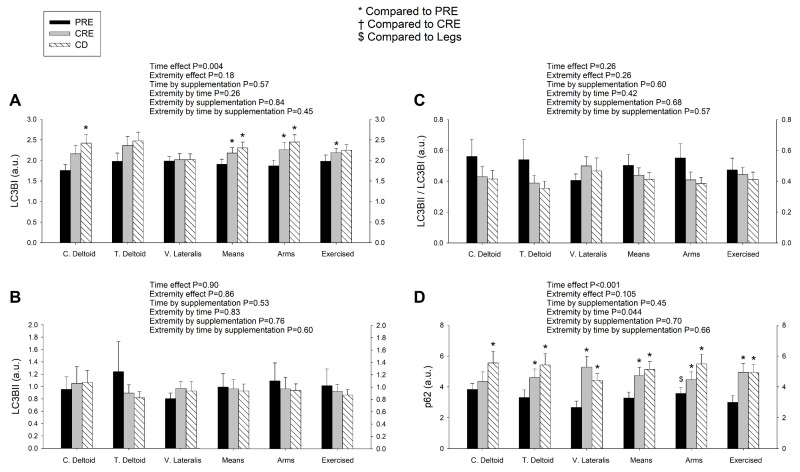
Figure 4.
LC3BI expression in skeletal muscle increases with a severe energy deficit, but LC3BII and the LC3BII/LCBI ratio remain unaltered, while the augmented levels of p62/SQSTM1 are amplified by exercise in a dose-dependent fashion. Protein expression levels of of LC3BI (A), LC3BII (B), ratio LC3BII/LCBI (C), and p62/SQSTM1 (D) in skeletal muscle following the three experimental phases. The various phases of the intervention are explained in Figure 1. PRE, before the intervention; CRE, caloric restriction and exercise; CD, control diet; C. Deltoid, control deltoid; T. Deltoid, trained deltoid; V. Lateralis, vastus lateralis; Means, (C. Deltoid + T. Deltoid + vastus lateralis)/3; Deltoid muscles, (C. Deltoid + T. Deltoid)/2; Exercised, (T. Deltoid + vastus lateralis)/2. n = 7 and n = 8 for the sucrose and whey protein groups, respectively. The statistical analysis was performed with logarithmically transformed data for all proteins. The values shown are means ± standard errors and expressed in arbitrary units (a.u.). *, p < 0.05 compared to PRE; and $, p < 0.05 compared to vastus lateralis.

