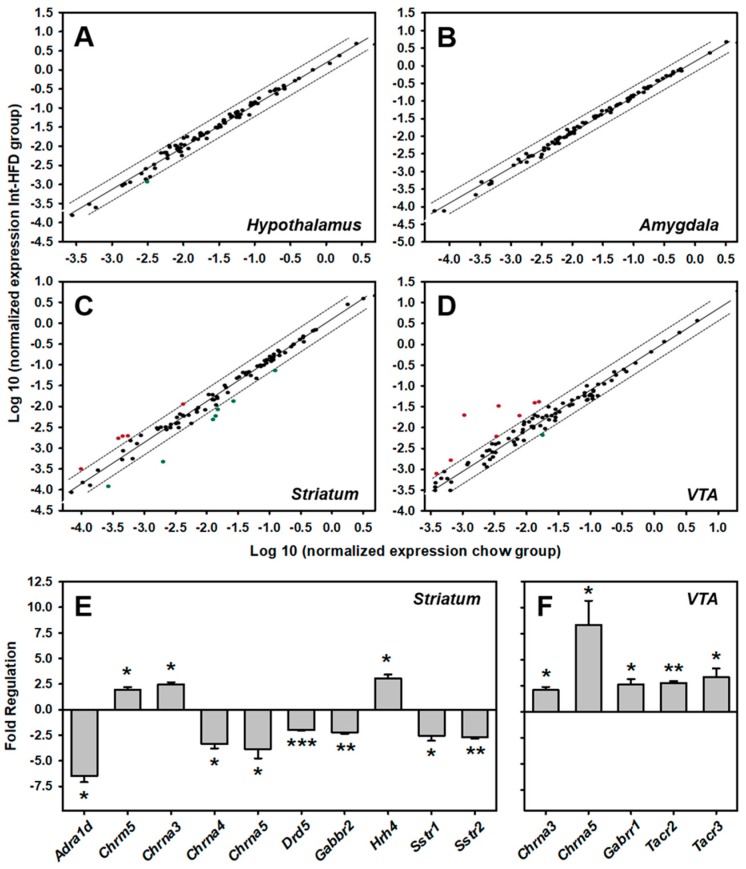
Figure 7.
The intermittent HFD cycling and central neurotransmitter receptors gene expression. A scatter plot analysis of differential central neurotransmitter receptors genes expression in the hypothalamus (A), amygdala (B), striatum (C) and VTA (D). Each dot represents one gene, and the top and bottom genes outside the dotted lines represent a two-fold increase and decrease, respectively. Statistically significant (p < 0.05) ≥ two-fold changes in several neurotransmitter receptors gene expression were only observed in the striatum (E) and VTA (F). * p < 0.05, ** p < 0.01 and *** p < 0.001 compared to the chow controls.

