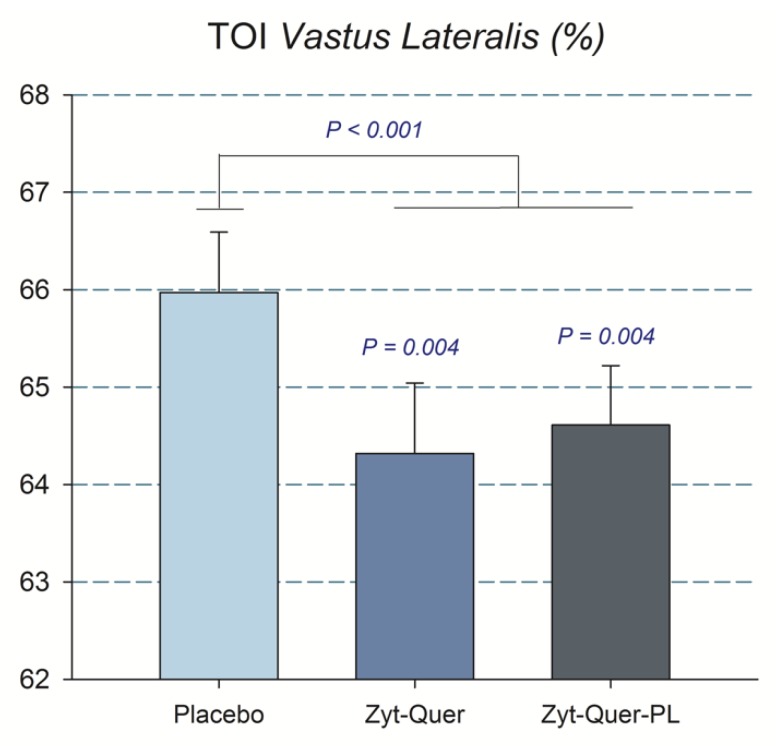
Figure 3.
Peak Power output. The bars correspond to the mean of the three sprints, after the ingestion of placebo, Zynamite® (Zyt) combined with quercetin (Quer) or Zynamite® combined with quercetin and phospholipids (PL). Error bars represent the standard error of the mean. p values: comparison with placebo. N = 40.

