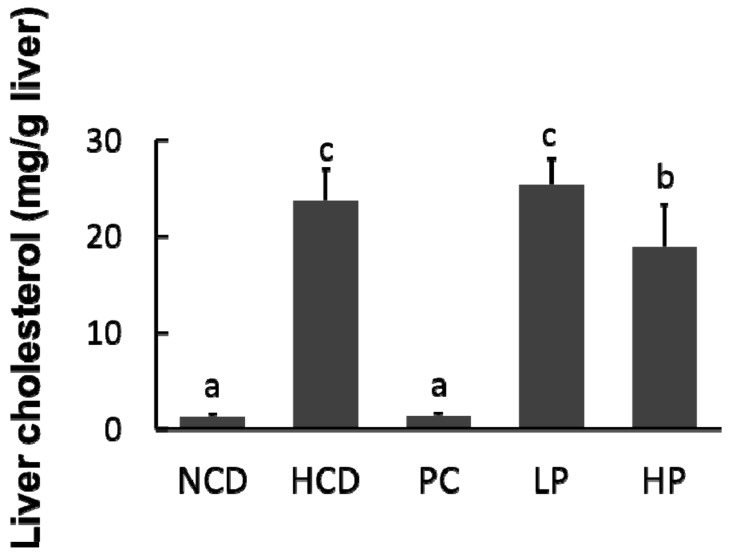
Figure 5.
Changes in relative liver cholesterol concentration in hamsters fed one of five diets: NCD, no cholesterol diet; HCD, high cholesterol diet containing 0.1% cholesterol; PC, high cholesterol diet containing 0.5% cholestyramine; LP, high cholesterol diet containing a low dose (0.1%) soybean germ phytosterols (SGP); HP, high cholesterol diet containing a high dose (0.2%) of soybean germ phytosterols (SGP). n = 8 for each group. a,b,c = means with different superscript letters differ significantly at p < 0.05.

