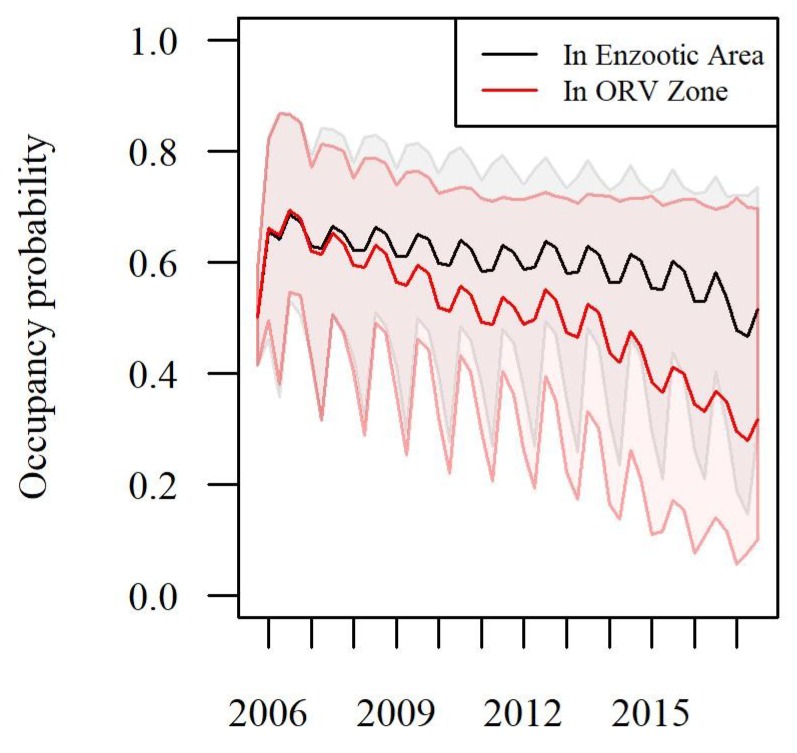
Figure 2.
The Probability of RABV occupancy from 2006 to 2017 in the northern counties of New York, Vermont and New Hampshire. The estimates are shown by season and by status of areas within the ORV management zone (red) and those south of the ORV management zone in the enzootic area (black). The shaded regions by color show the 95% confidence intervals.

