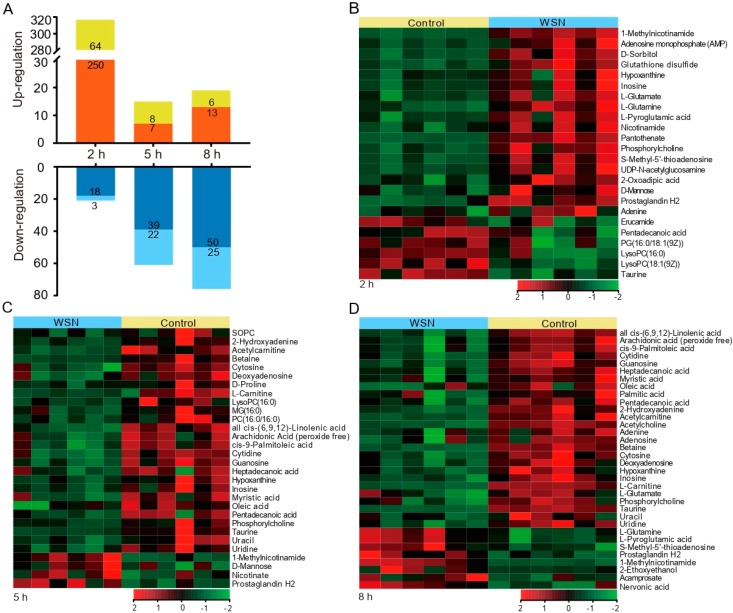
Figure 2.
Identification and characterization of altered metabolites after IAV infection. (A), Bar graph showing a large number of metabolite changes. The X-axis represents the time point, and the negative log10 of the p-value on the y-axis. The metabolites with log2 fold changes >1 or <−1 and −log10 p > 1.3 were significantly different. Red (positive ion modes) and yellow (negative ion modes) indicate up-regulated, while dark blue (positive ion modes) and light blue (negative ion modes) indicate down-regulated. (B–D), A549 cells were infected with A/WSN/1933 viruses at a MOI of 0.1 for 2 h (B), 5 h (C), and 8 h (D). Total metabolites were extracted and used for metabolomic analysis. The expression values shown in shades of green and red indicate gene levels below and above the median expression value across all the samples (log2, from −2 to +2), respectively. Each row is a differential metabolite, and each column represents a replicate of a group.

