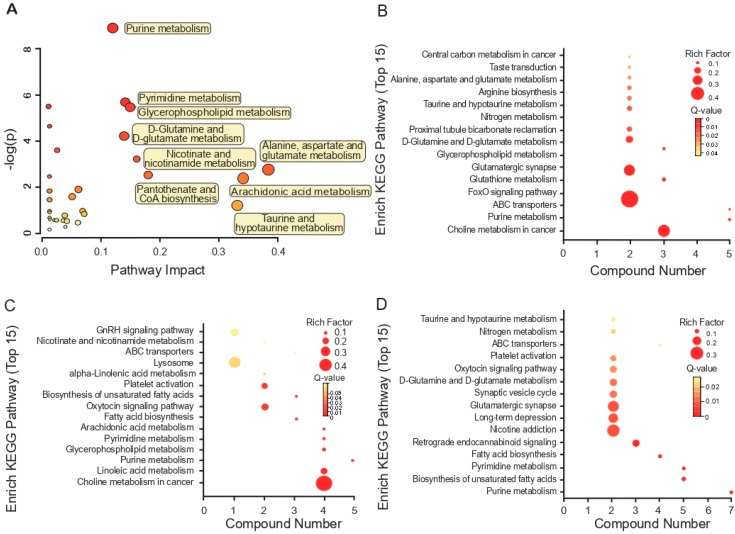
Figure 3.
Top 15 enriched pathways based on characteristic metabolites in A/WSN/1933-infected cells. Pathway analysis allowed the construction of a scatter plot of KEGG pathway enrichment statistics for characteristic metabolites following A/WSN/1933 infection of A549 cells. (A) Global metabolic disorders of the most relevant pathways induced by A/WSN/1933 were revealed using MetaboAnalyst 4.0. “Pathway Impact” means that the selected metabolites conducted topological analysis of the metabolic pathway according to their different positions in the metabolic pathway. The corresponding score is shown on the X-axis, and the p-value (Y-axis) of the metabolic pathway enrichment analysis is selected as the most valuable metabolic pathway, (B–D). Rich factor is the ratio of the number of differentially expressed genes noted in the pathway terms to all metabolite numbers found in this pathway term. We selected the top 15 of the KEGG enrichment results as a reference. “Compound number” is the compounds here referring to the ones in Table 1. A greater Rich Factor indicates higher intensity. To control the false discovery rate (FDR), we used q = 0.05 to correct the p-value of the metabolites, ranging from 0 to 1. A lower q-value indicates higher intensity.

