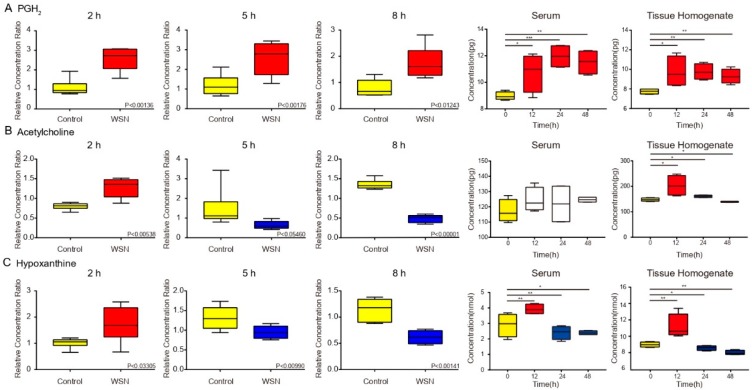
Figure 5.
Key metabolites by box plots of different times by infection. Metabolite concentration changes in (A) PGH2, (B) acetylcholine, (C) hypoxanthine, extracted from human cells, serum, and lung tissue post-infection were determined by using each peak intensity ratio. Each p-value is filled on the box plot with the metabolite name, and the maximum/minimum value and dispersion of the data are illustrated in GC/MS chromatograms.

