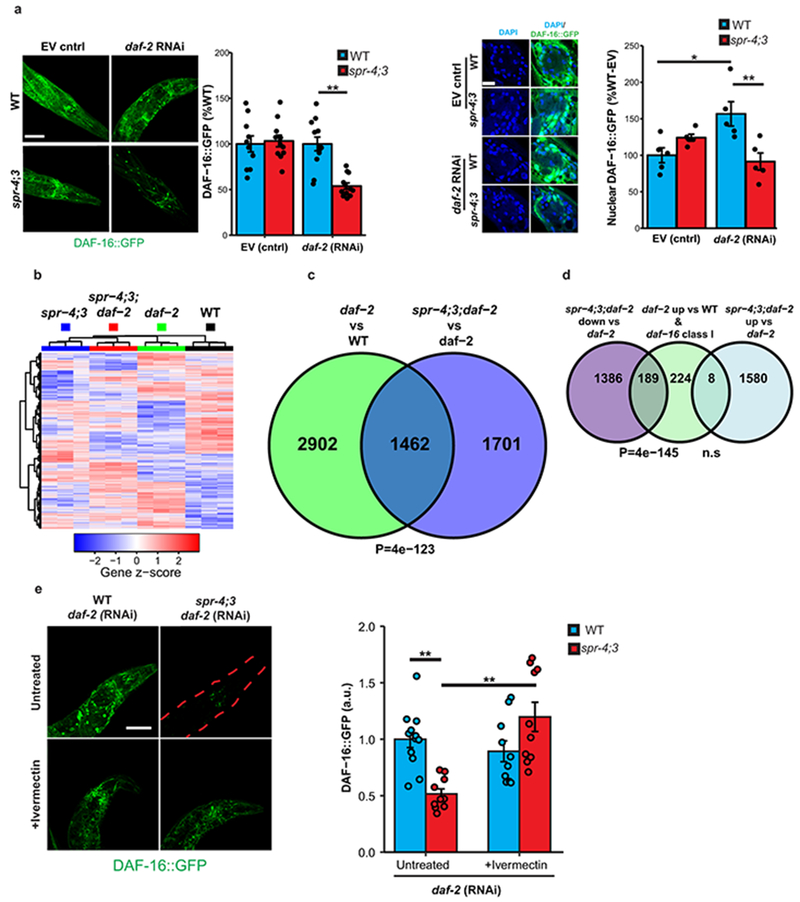
Extended Data Figure 9. Regulation of DAF-16 by SPR-3 and SPR-4.
a, Reduced DAF-16 activation in spr-4;3 mutants following daf-2 RNAi. Left confocal panel: Shown are day 10 worms of the indicated genotypes expressing an integrated DAF-16::GFP transgene and treated with daf-2 RNAi or empty vector (EV) control since day 1 of adulthood. Images are maximum intensity z-projections. Scale bar, 40μm. Left bar graph: Values represent mean GFP intensity ± S.E.M. in the peri-pharyngeal regions of spr-4;3 double mutants relative to wild-type controls for a representative experiment replicated 4 times (see methods for details of analysis). (n=8-12 worms per replicate). **P=5.2e-5 by Welch’s t-test. Right confocal panel: Higher magnification views of DAF-16::GFP and DAPI-labeled nuclei. Images are magnified confocal z-planes. Scale bar, 10μm. Right bar graph: Values represent mean nuclear GFP intensity ± S.E.M. relative to the WT-EV control, n=5 worms per genotype and 51-89 nuclei per worm. *P=0.016, **P=5.5e-3 by ANOVA with post-hoc Tukey test. Values and images are representative of an experiment replicated 3 times. b, Gene expression determined by RNA sequencing in adult day 10 worms. Differentially expressed genes (rows) and replicates of the indicated worm genotypes (columns) were clustered, and gene expression, transformed to a z-score per gene, is represented in a heat map. n=3 independent replicates per genotype. c, Venn diagram illustrating the overlap of differentially expressed genes in day 10 daf-2 vs WT and spr-4;3;daf-2 vs daf-2 comparisons. P=4e-123, Fisher’s exact test with a one-sided alternative hypothesis. d, Overlap of class I daf-16 target genes (described in Methods) with genes downregulated in day 10 spr-4;3;daf-2 triple mutants relative to daf-2 single mutants. P-values were calculated using a hypergeometric distribution (see Methods). n.s, p=0.99 e, Ivermectin increases DAF-16::GFP levels in spr-4;3 worms following daf-2 RNAi. Left panel: Confocal imaging of GFP fluorescence in ivermectin-treated (10 pg/ml) and untreated worms. The red dashed lines indicate the worm body. Right panel: Quantification of DAF-16::GFP. Values represent mean GFP intensity ± S.E.M., WT/Untreated, n=12; WT/Ivermectin, n=10; spr-4;3/Untreated, n=10; spr-4;3/Ivermectin, n=10. **P=4.6e-4 (spr-4;3 vs WT untreated), P=2.6e-4 (spr-4;3 +Ivermectin vs spr-4;3 untreated) by Mann–Whitney U test with multiple testing correction by Holm’s method. Shown is a representative experiment replicated 3 times.

