Figure 2.
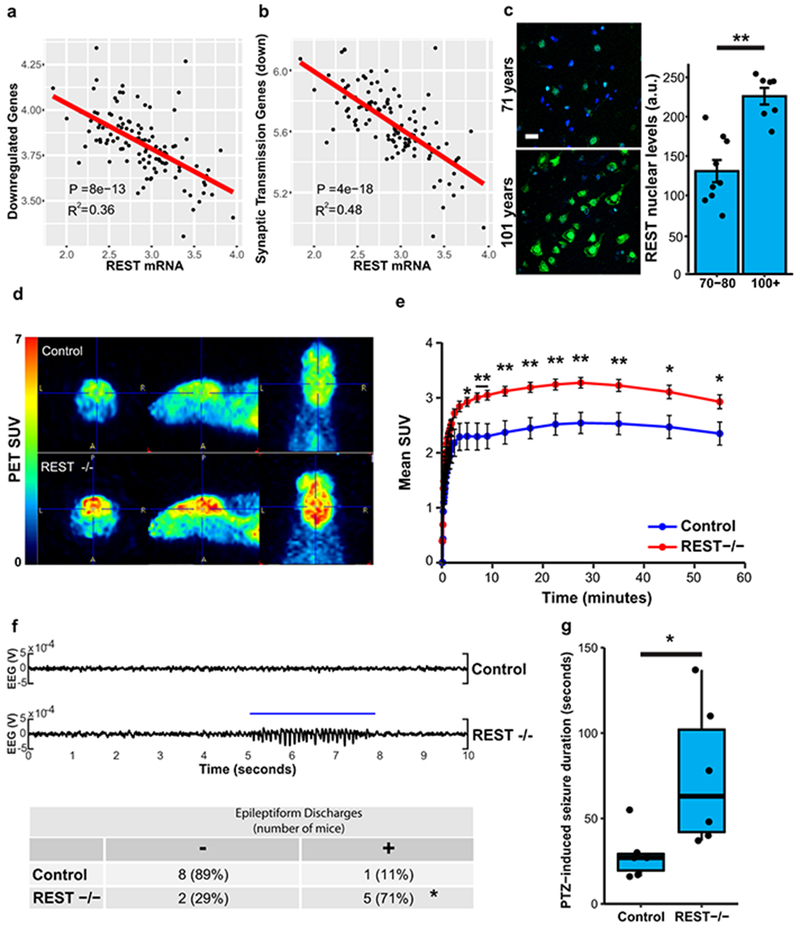
REST regulates neural excitation in the aging brain and is associated with extended longevity. a-b, Expression of genes downregulated in individuals with extended longevity (≥85 versus ≤80 years old) is inversely related to REST mRNA levels. Shown is linear regression analysis of the mean expression of a, all downregulated genes and b, downregulated genes associated with the synaptic transmission GO term. Data is from the ROSMAP cohort. Each point represents an individual case (n=117). P-values were derived by t-tests of the regression line slopes. c, Increased nuclear REST levels in the prefrontal cortex of centenarians. Left panel: Immunofluorescence labeling for REST (green, rabbit polyclonal; Bethyl laboratories) and DAPI (blue) in human prefrontal cortex. Scale bar, 40 μm. Right panel: Nuclear REST levels in cognitively intact individuals 70-80 years (n=9) and >100 years (n=7) of age. Values represent the mean ± S.E.M, **P=1.5e-4, Student’s t-test. d, REST represses neural excitation in the mouse cerebral cortex. Shown are images from PET-CT scanning of fluorodeoxyglucose (18F-FDG) uptake in 18-month-old Nestin-Cre;RESTlx/lx (REST−/−) and age-matched RESTlx/lx (Control) mice. e, Average standardized uptake value (SUV) at increasing time intervals after injection of 18F-FDG. Values represent the mean ± S.E.M., n=7 mice per group. *P<0.05, **P<0.01, Mann-Whitney U test. f, Increased epileptiform discharges in aged REST-deficient mice. Upper Panel: EEG recording from REST(−/−) and age-matched control mice. Lower Panel: Number of mice with at least one epileptiform discharge (≥ 3 secs) in a 48 hour recording. Control, n=9; REST−/−, n=7. *P=0.035, Fisher’s exact test. g, Seizure duration after administration of PTZ (40 mg/kg). Control, n=6; REST −/−, n=6 mice. *P=0.016, Mann–Whitney U test.

