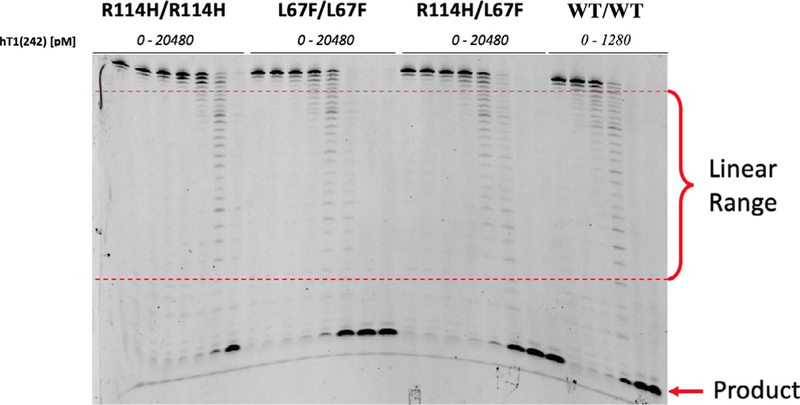
Fig. 2.
Phase I gel results for TREX1 ssDNA exonuclease assay. Degradation of a FAM-labeled 30-mer oligonucleotide substrate [50 nM] by varying concentrations of hTREX1 enzymes visualized on a 23% urea polyacrylamide gel. Banding consistent with the linear range of the assay is identified as “Linear Range.” Banding that corresponds to accumulating product is labeled as “Product.”

