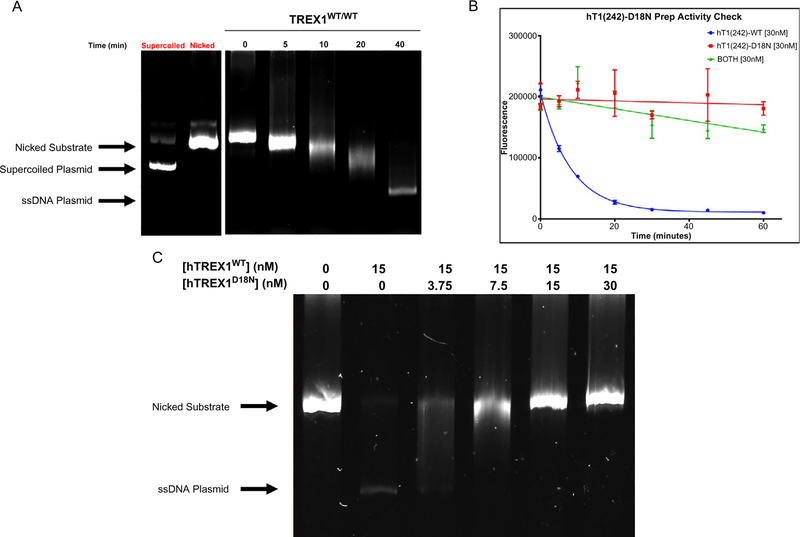
Fig. 3.
Results of TREX1 dsDNA fluorescence and agarose gel assays. (A) Degradation of 10 ng/μL Nt.BbvCI-nicked pMYC substrate by 15 nM hTREX1WT/WT visualized on a 0.8% agarose gel. Bands corresponding to supercoiled and nicked plasmid are indicated. TREX1 excises dNMPs from the nicked polynucleotide of the dsDNA plasmid generating a single-stranded DNA polymer. The position of migration of the ssDNA polymer is identified as “ssDNA.” The gel lanes from left to right are: supercoiled (un-nicked) plasmid, nicked plasmid, reaction samples at the indicated times (min). (B) Degradation of 10 ng/μL Nt.BbvCI-nicked pMYC dsDNA by 30 nM hTREX1WT/WT and/or 30 nM hTREX1D18N/D18N, visualized via fluorescence. Fluorescence values for the indicated time points for each reaction indicated were plotted as a function of fluorescence vs time in Prism7 (GraphPad), and fitted with one-phase decay nonlinear regression. (C) Degradation of 5 ng/μL Nt.BbvCI-nicked pMYC substrate by 15 nM hTREX1WT/WT in the presence of increasing concentrations of hTREX1D18N, visualized on a 0.8% agarose gel. Bands corresponding to undegraded substrate are indicated.

