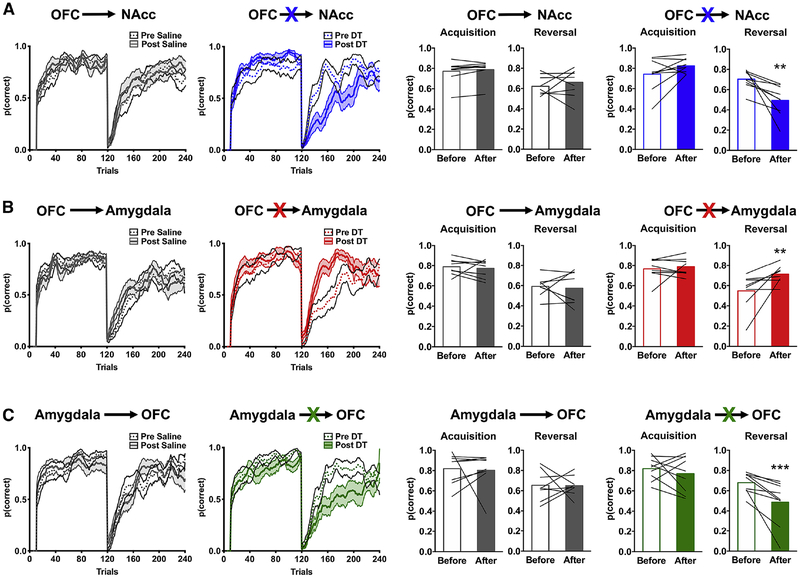
Figure 3:
Ablation of directionally specific OFC circuits disrupts reversal learning performance. The probability of choosing correct noseports, p(correct), before (solid line) and after (dotted line) administration of saline (left) or DT (right) is shown for rats where the OFC→NAcc (A), OFC→Amygdala (B), or Amygdala→OFC (C) was targeted using a 10-trial moving average. The right bar graphs show the average p(correct) for the acquisition and reversal phase before (open bars) and after (closed bars) administration of saline (gray bars) or DT (colored bars). Values plotted are thin lines representing individual rats and averages ± SEM. ** p<0.01; *** p<0.001 denotes that values after DT administration were different from values before DT administration. Related to Supplemental Figure 3 and 4.

