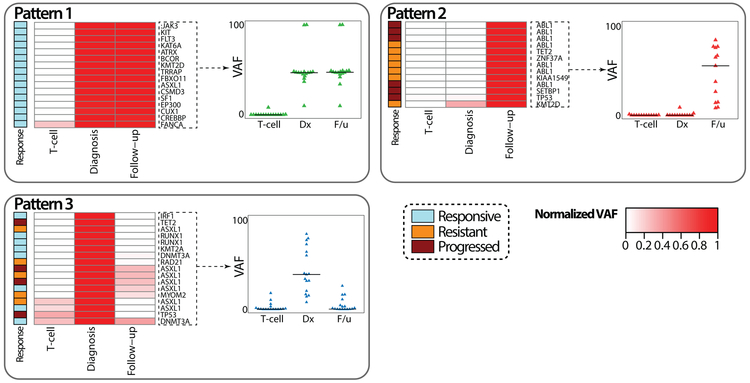
Figure 3. Dynamics of somatic mutation profiles following TKI therapy.
Five patterns of mutation dynamics are noted according to their longitudinal changes in mutation burden following TKI therapy. Pattern 1 does not show any significant changes but all the cases responded to TKI therapy optimally, implying independence of the clone carrying the mutation from the Ph-positive clone. Pattern 2 represents new acquisition of mutations, associated with treatment failure. Pattern 3 shows a linear relationship between the reduction rate of mutation allele burden and BCR-ABL1 transcript level reduction, implying that this mutation arose from the Ph-positive clone. Modified from Kim et al. [31].

