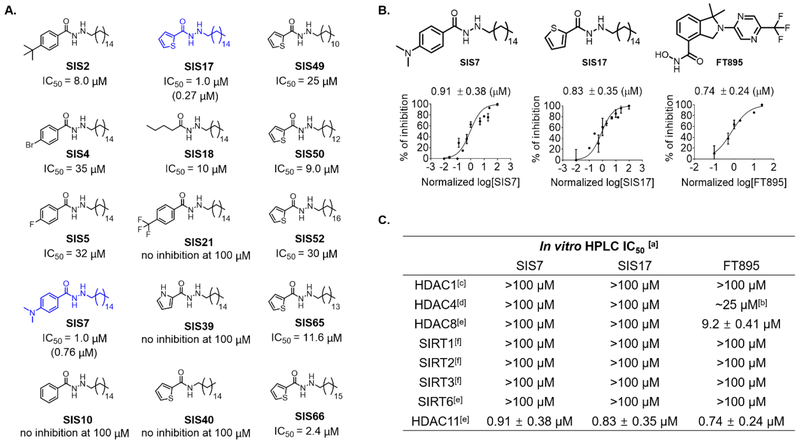
Figure 2.
In vitro assay with HDAC11 inhibitors. (A) Optimization of HDAC11 inhibitors based on SIS4. Optimization of HDAC11 inhibitors based on SIS4. IC50 values were obtained by using myristoyl-H3K9 peptide as the substrate except values shown in parentheses for SIS7 and SIS17, which are measured using myristoyl-SHMT2 peptide as the substrate. Some of the IC50 curves are shown in Supplementary Figure 1. (B) Comparing SIS7 and SIS17 to FT895 on HDAC11 inhibition using myristoyl-H3K9. IC50 values using myristoyl-H3K9 derived from GraphPad Prism are presented as mean values from three independent experiments. (C) In vitro IC50 values against different HDACs and sirtuins with acyl-H3K9 peptides. [a] acyl-H3K9 peptides used. [b] FT895 inhibited 50% of HDAC4 activity at 25 μM but inhibition with higher concentration did not increase inhibition rate. [c] Deacetylation activity of enzyme tested. [d] Detrifluoroacetylation activity of enzyme tested. [e] Demyristoylation activity of enzyme tested. [f] Both deacetylation and demyristoylation activities of enzyme tested.

